category and group data#
Inspection of the network traffic identifies two data feeds that look as if they are defined at the overall event level:
category-2025allGroups-2025
The above path components are added to the end of the “base” live data feed API (Application Programming Interface) location https://www.dakar.live.worldrallyraidchampionship.com/api/ to generate the resource location web address:
APIs
APIs (application programming interfaces) are like web pages for machines. They define how to access or search for resources in a well-defined way, and provide results structured in a way that makes it other for other machines, or programming code, to work with.
These data sets are perhaps not the most interesting of the data feeds, but we have to start somewhere. And if you are a keen data junkie, it’s often the adminstrative data that lets you wrangle your datasets in really creative ways. If you are crioous enoguh, even the most mundane data set may trigger some interesting questions or observations. And if nothing else, working with any new data set can often be regarded as a fitness work out.
Importing Packages In Python#
The Python programming language is a quick-to-get-started-with programming language that is used as a general purpose programming language in a wide variety of contexts, from business applications to scientific research, gaming to data analysis.
Syntax is important, which is to say that where you put the spaces often matters, and you need to pay attention to spelling and case (capitalisation).
Some words, and some things that don’t quite look like properly spelled words, are reserved; which is to say, they are part of the actual language and you can’t use them for anything else.
Whilst you might think that the purpose of code is to get stuff done, most code is used to create code that is used to create other bits of code that may or may not be used to get stuff done at some point in the future. Added to that, most things you think you probably want to do with your code will have probably already been figured out by someone before you.
In the Python world, there is a huge number of packages that have been developed to do particular things.
In this book, or guide, or whatever it is, we’ll be using the pandas data analysis package a lot. This package has been developed over many years to provide a powerful set of tools for working with tabular datasets.
If you use spreadsheet applications such as Excel, you’ll already be familiar with the idea of tabular data. And you’ll probably also be familiar with the idea of column and row based operations, as well as formulas. The pandas package provides support for a similarly comnprehensive range of operations using code.
If you’re using one of the environments developed for use with this book, it should already have all the bits and bobs you need installed into it.
If the packages are installed and available in your environment, all you need to do to start working with them is to import them.
In the following code cell, I’m going to import the pandas package for working with tabular data. By convention, this is referred to by the shorthand label pd.
# This is a code cell
#
# Lines that start with a # are "comment" lines.
# Comments are not executed as code.
#  They provide an opportunity for writing free text,
# and explanatory text, in a code cell.

# To execute a line of code, click in the code cell to select it
# either click the play button, or use the keyboard shortcut `shift-enter`
import pandas as pd
Previewing the Category data#
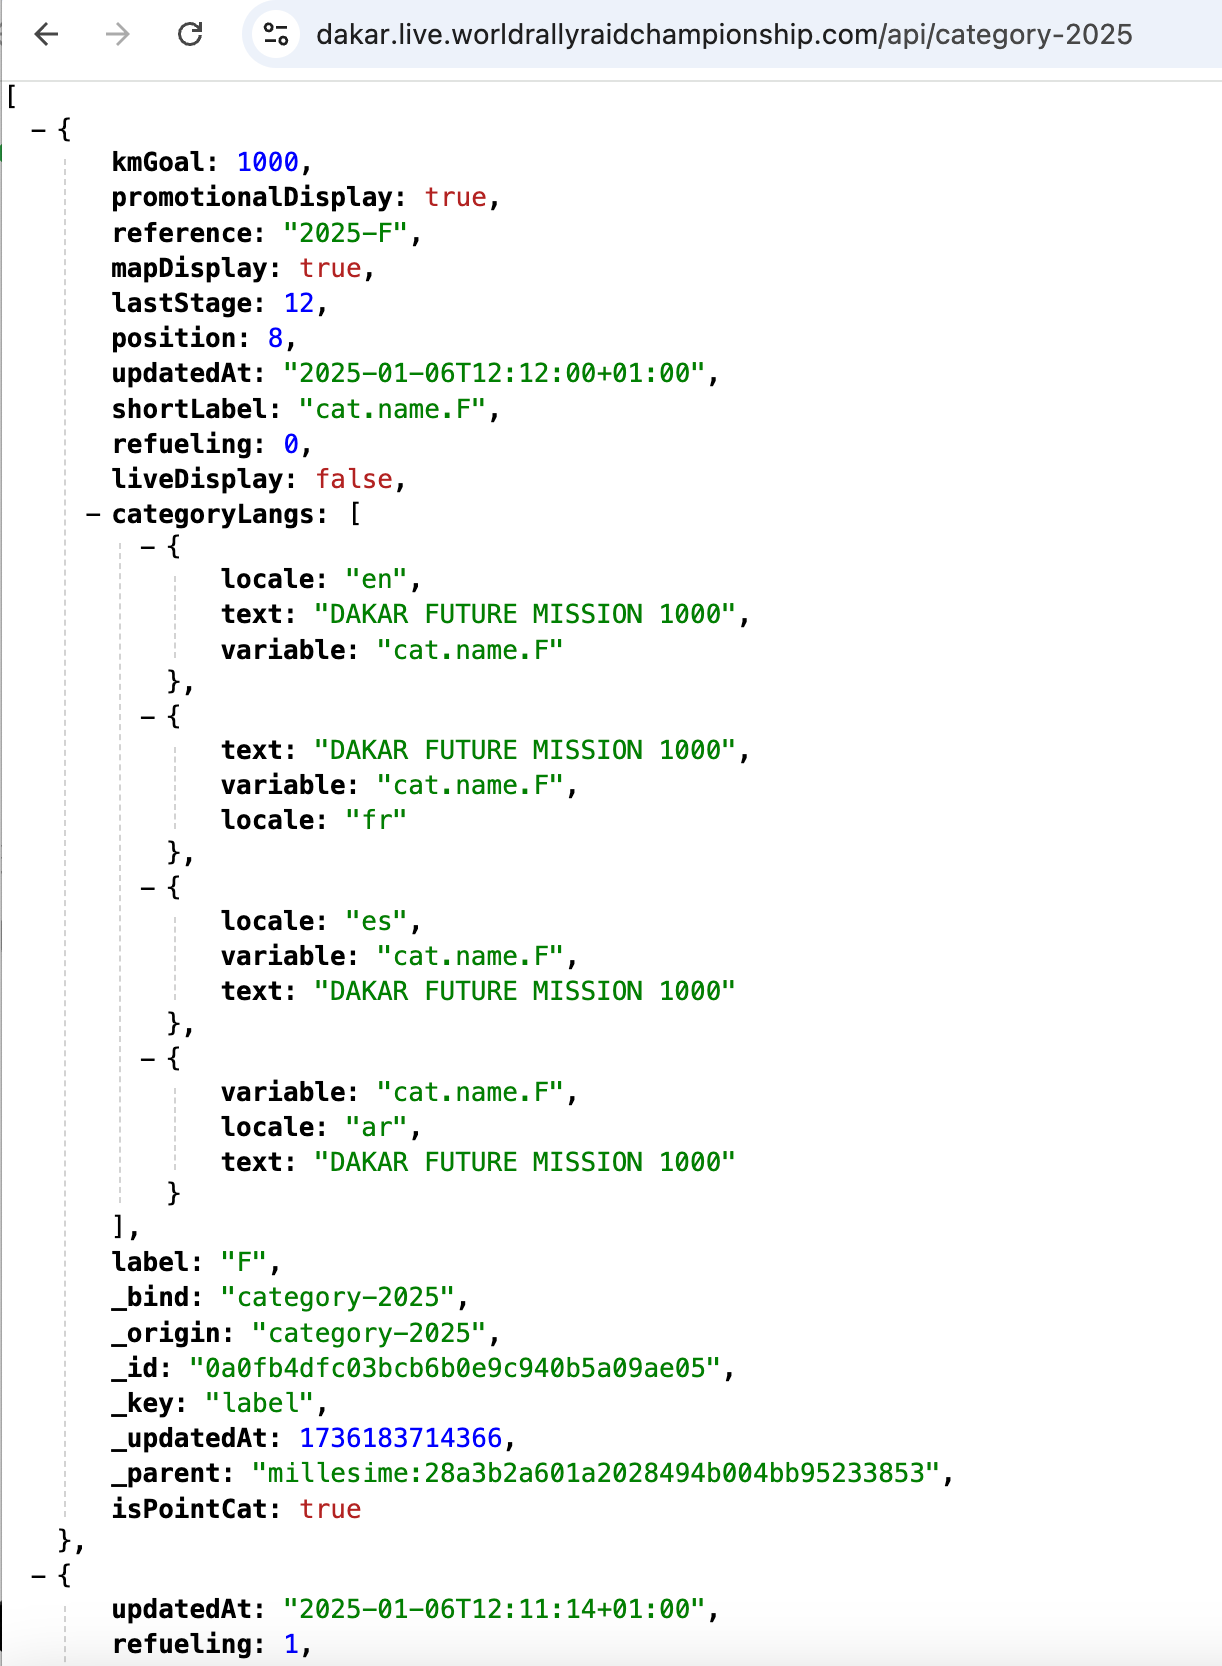
We can preview the allGroups data by clicking on the link to the resource and viewing it “as a webpage”. By default, the display may not be overly friendly, so I tend to view it in a browser via a browser extension.
By inspection, I can see the data file is a JSON (Javascript Object Notation) data file: the presence of square brackets, identifying lists of items, and curly brackets ({}) wrapping key:value pairs give the game away. In Chrome, I use the JSONVue web extension for automatically previewing JSON data in a syntax sensitive way. The following screenshot of the category data is viewed in Chrome using this extension.
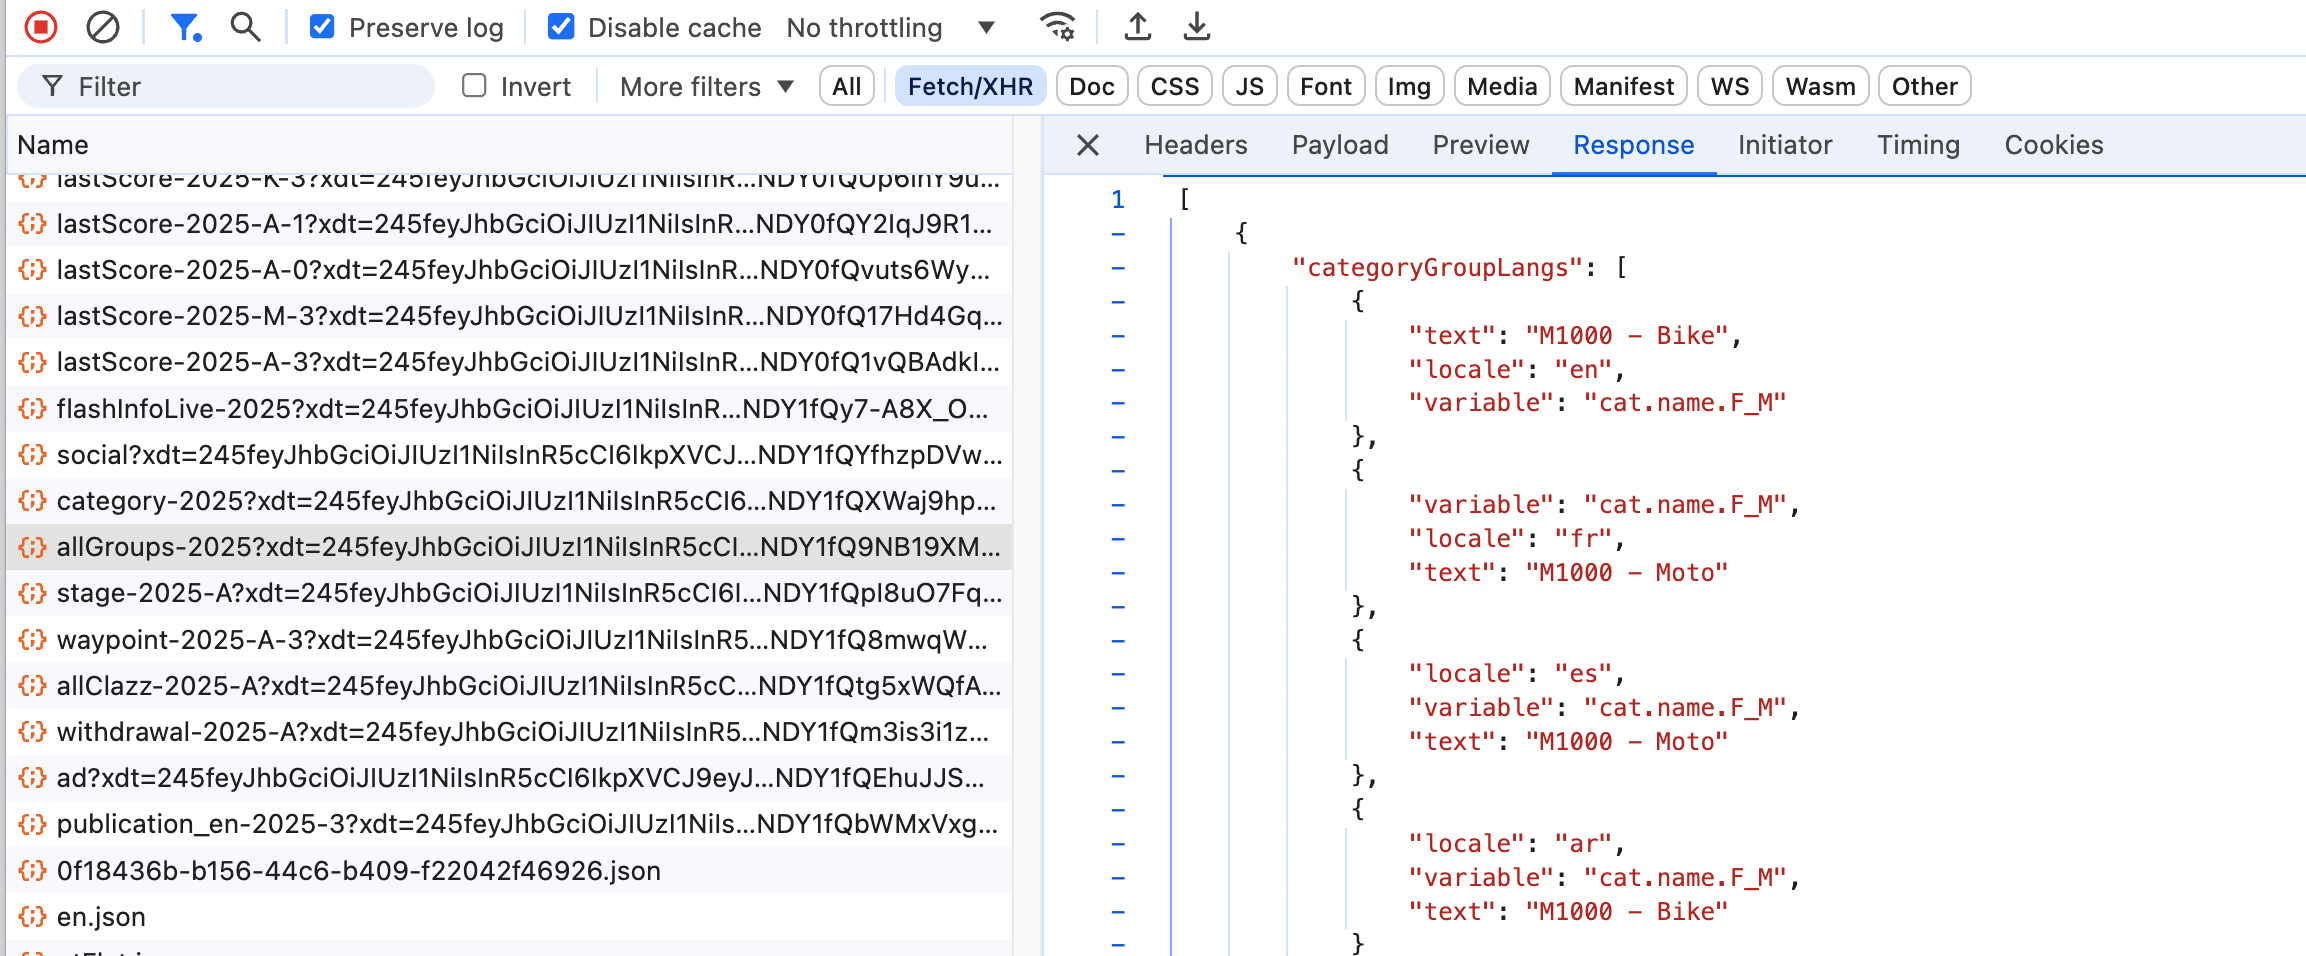
We can also preview the contents of the file via browser developer tools by selecting the file in the Network view and then clicking on the Response tab to see what data was returned when the corresponding resource was requested.
We can also grab a copy of the data programmatically using the Python requests package.
To start with, let’s construct the URL for the resource we want to request. This is made up from two parts: the “base” API location, and the resource we want to request from that API.
One practical way of constructing the URL is to use a string template.
A string is just a series of alphanumeric and punctuation text characters.
The template part of the string allows us to specify a variable placeholder value that can be substituted with another value as required.
# In a programming language, we can use "variables" as shorthand
# ways of referring to other things.
# variableName = VARIABLE_VALUE

# In the following, the {path} element defineds a placeholder for a
# variable value substitution that can be applied later
dakar_api_template = "https://www.dakar.live.worldrallyraidchampionship.com/api/{path}"
We can define another variable that specifies the path to the API resource we want to request:
# Define the API path to the category resource
category_path = "category-2025"

# Substitute in the groups_path value into the API URL template
category_url = dakar_api_template.format(path=category_path)

# Placing a Python object at the end of a notebook code cell
# gives us a simple way of previewing its value when the cell is run
category_url
'https://www.dakar.live.worldrallyraidchampionship.com/api/category-2025'
Fudging the URL
If you are running the code associated with this book in the JupyterLite environment, you may run into problems trying to retrieve the data from the Dakar live data website. These problems arise from browser security policies associated with Cross-Origin Resource Sharing (CORS), which is to saying, trying to make requests to one website from another website.
One way around this problem is to request the data via a proxy (an intermediate website) that does support cross-origin requests.
When requesting a URL using the requests package I recommend wrapping the URL in the xurl() (cross-origin URL) function imported from the jupyterlite_simple_cors_proxy package when making requests using the requests package, and the furl() (file-object URL) function when making the request using the pandas read_json() package.
from jupyterlite_simple_cors_proxy import furl, xurl
Since we know the data returned from the API is presented as JSON data, we can attempt to parse it directly using the pd.read_json(URL) function:
# Use the pandas .read_json() function to load JSON data from a URL
# and parse it into a dataframe object
# Use furl() to handle CORS issues in Jupyterlite
category_df = pd.read_json(furl(category_url))

# View the result
category_df
| position | updatedAt | refueling | label | kmGoal | categoryLangs | mapDisplay | lastStage | promotionalDisplay | reference | shortLabel | liveDisplay | _bind | _origin | _id | _key | _updatedAt | _parent | isPointCat | |
|---|---|---|---|---|---|---|---|---|---|---|---|---|---|---|---|---|---|---|---|
| 0 | 8 | 2025-01-06T12:12:00+01:00 | 0 | F | 1000.0 | [{'locale': 'en', 'variable': 'cat.name.F', 't... | True | 12 | True | 2025-F | cat.name.F | False | category-2025 | category-2025 | 0a0fb4dfc03bcb6b0e9c940b5a09ae05 | label | 1737386137350 | millesime:28a3b2a601a2028494b004bb95233853 | 1.0 |
| 1 | 3 | 2025-01-06T12:11:14+01:00 | 1 | A | NaN | [{'text': 'Car', 'locale': 'en', 'variable': '... | True | 12 | True | 2025-A | cat.name.A | True | category-2025 | category-2025 | 63b4f5da4591200d0a4cc239245eb03a | label | 1737386137350 | millesime:28a3b2a601a2028494b004bb95233853 | NaN |
| 2 | 7 | 2025-01-06T12:11:52+01:00 | 0 | K | NaN | [{'locale': 'en', 'variable': 'cat.name.K', 't... | True | 12 | True | 2025-K | cat.name.K | False | category-2025 | category-2025 | b0b0b0087d69431d87d04800e254c7c3 | label | 1737386137350 | millesime:28a3b2a601a2028494b004bb95233853 | 1.0 |
| 3 | 0 | 2025-01-05T20:25:31+01:00 | 1 | M | NaN | [{'text': 'Bike', 'variable': 'cat.name.M', 'l... | True | 12 | True | 2025-M | cat.name.M | True | category-2025 | category-2025 | e377e0f7b61dcf8217845dc4fac8cc5d | label | 1737386137350 | millesime:28a3b2a601a2028494b004bb95233853 | NaN |
The category data seems to be quite limited, identifying some catregory codes (the labels F, A, K and M that we perhaps recognise from some of the API URL paths). There do appear to be text labels for various languages provided in the categoryLangs column.
Each entry in the categoryLangs column looks to be a list of dictionaries. We can select just that column from the dataframe as category_df["categoryLangs"] and then unpack each list to a separate row by applying the .explode() method to the column.
This unpacks each list to a separate row:
category_df[["reference", "categoryLangs"]].explode(column="categoryLangs")
| reference | categoryLangs | |
|---|---|---|
| 0 | 2025-F | {'locale': 'en', 'variable': 'cat.name.F', 'te... |
| 0 | 2025-F | {'variable': 'cat.name.F', 'text': 'DAKAR FUTU... |
| 0 | 2025-F | {'variable': 'cat.name.F', 'text': 'DAKAR FUTU... |
| 0 | 2025-F | {'variable': 'cat.name.F', 'locale': 'ar', 'te... |
| 1 | 2025-A | {'text': 'Car', 'locale': 'en', 'variable': 'c... |
| 1 | 2025-A | {'text': 'Auto', 'locale': 'fr', 'variable': '... |
| 1 | 2025-A | {'text': 'Coche', 'variable': 'cat.name.A', 'l... |
| 1 | 2025-A | {'text': 'سيارات', 'locale': 'ar', 'variable':... |
| 2 | 2025-K | {'locale': 'en', 'variable': 'cat.name.K', 'te... |
| 2 | 2025-K | {'variable': 'cat.name.K', 'text': 'Classic', ... |
| 2 | 2025-K | {'variable': 'cat.name.K', 'text': 'Classic', ... |
| 2 | 2025-K | {'variable': 'cat.name.K', 'text': 'Classic', ... |
| 3 | 2025-M | {'text': 'Bike', 'variable': 'cat.name.M', 'lo... |
| 3 | 2025-M | {'text': 'Moto', 'locale': 'fr', 'variable': '... |
| 3 | 2025-M | {'text': 'Moto', 'locale': 'es', 'variable': '... |
| 3 | 2025-M | {'variable': 'cat.name.M', 'text': 'دراجة', 'l... |
The result is a pandas.Series object (essentially, a 1-dimensional dataframe), where each item is a Python dictionary. It’s still rather hard to read in this form, but we can “normalise” it by parsing each dictionary into its own dataframe row using the pd.json_normalize() function:
# Parse the exploded Series of dicts into a dataframe
pd.json_normalize(category_df["categoryLangs"].explode())
| locale | variable | text | |
|---|---|---|---|
| 0 | en | cat.name.F | DAKAR FUTURE MISSION 1000 |
| 1 | fr | cat.name.F | DAKAR FUTURE MISSION 1000 |
| 2 | es | cat.name.F | DAKAR FUTURE MISSION 1000 |
| 3 | ar | cat.name.F | DAKAR FUTURE MISSION 1000 |
| 4 | en | cat.name.A | Car |
| 5 | fr | cat.name.A | Auto |
| 6 | es | cat.name.A | Coche |
| 7 | ar | cat.name.A | سيارات |
| 8 | en | cat.name.K | Classic |
| 9 | fr | cat.name.K | Classic |
| 10 | es | cat.name.K | Classic |
| 11 | ar | cat.name.K | Classic |
| 12 | en | cat.name.M | Bike |
| 13 | fr | cat.name.M | Moto |
| 14 | es | cat.name.M | Moto |
| 15 | ar | cat.name.M | دراجة |
By inspection, we can now see that the `A category refers to the Auto or Car category, the M category to Moto, which is to say, Bike, and so on.
Previewing the allGroups data#
As before, we can preview the allGroups data by clicking on the link and viewing the response in a web browser, or in browser developer tools by clicking on a corresponding netwrok traffic link and viewing the response.
We can, of course, also retrieve the resource programmatically.
The quickest way of loading this data into a pandas dataframe is to load the JSON data from the live data API directly using the pd.read_json(URL) function.
But let’s step back a moment to see what sorts of thing might be involved in making such a request.
To begin with, how can we get the data from the API? The Python language provides a range of low level tools for making a connection to remote web server and retrieving the result. At a slightly higher level of abstraction, the requests package provides a set of tools for requesting resources from web locations, checking the response status of such requests, and accessing the response data.
To make use of the package, we need to load it it:
import requests
In order to make the request, we need to construct our target URL:
# Define the API path to the groups resource
groups_path = "allGroups-2025"

# If you are thinking ahead, you might be wondering
# whether we could specify a YEAR variable and then
# substitute that in. And indeed we could.
# YEAR = 2025
# In this case it would be simpler to direct apply the substitution
# using by using a Python f-string construction:
# groups_path = f"allGroups-{YEAR}"
# The preceding f" says: substitute in values of corresponding variables

# Substitute in the groups_path value into the API URL template
groups_url = dakar_api_template.format(path=groups_path)

# Preview the URL
groups_url
'https://www.dakar.live.worldrallyraidchampionship.com/api/allGroups-2025'
We can now request the resource from the URL using the get() command from the requests package:
# Request the resource from the specified URL
# Use xurl() to handle CORS issues in Jupyterlite
r = requests.get(xurl(groups_url))

# We can preview the returned text as a text string.
# The [:100] limit says: "just return the first 100 characters"
r.text[:100]
'[{"updatedAt":"2025-01-05T20:25:31+01:00","position":0,"shortLabel":"cat.name.F_M","liveDisplay":fal'
Noting that the data returned from the API is presented as JSON data, we can use the .json() method that is pre-defined on the requests response object to parse the data as such and return a corresponding Python object:
# Preview the response data as parsed JSON data
groups_json = r.json()

# Uncomment the final line to preview the result
# groups_json
By inspection of the groups_json dictionary, or even just the first few characters of the original response data, we note the data is structured in the following way:
[{"categoryGroupLangs":[{"text":"M1000 - Bike","locale":"en","variable":"cat.name.F_M"}...
The opening square bracket ([) identifies that we have a list of items. The curly brackets ({) identify that we likely have a list of object items (in Python, a set or a dictionary, depending on the structure of the contents).
Knowing that we have a list, we can index into the list to display the first item in the list, which has index value 0. We can also index the nth value as [n-1] and the last item in the list as index [-1].
# Preview the first item (index value 0) in the list
groups_json[0]
# We could also index the second item as [1],
# the fourth as [3], the n'th as [n-1],
# and the final item as [-1]

# Note that comments are ignored and don't count as
# "last line in the cell" display items...
{'updatedAt': '2025-01-05T20:25:31+01:00',
 'position': 0,
 'shortLabel': 'cat.name.F_M',
 'liveDisplay': False,
 'reference': '2025-F-M',
 'categoryGroupLangs': [{'locale': 'en',
   'text': 'M1000 - Bike',
   'variable': 'cat.name.F_M'},
  {'text': 'M1000 - Moto', 'locale': 'fr', 'variable': 'cat.name.F_M'},
  {'locale': 'es', 'variable': 'cat.name.F_M', 'text': 'M1000 - Moto'},
  {'variable': 'cat.name.F_M', 'text': 'M1000 - Bike', 'locale': 'ar'}],
 'label': 'M',
 'tinyLabel': 'M',
 'refueling': 0,
 'promotionalDisplay': False,
 '_bind': 'allGroups-2025',
 '_origin': 'categoryGroup-2025-F',
 '_id': 'ae6882fe1fcb5dbef0a7e42d7ca802c1',
 '_key': 'label',
 '_updatedAt': 1737386137501,
 '_parent': 'category-2025:0a0fb4dfc03bcb6b0e9c940b5a09ae05'}
Having a sense of the shape and structure of the data then suggests how we might want to try to represent it in a more convenient way, at least from the perspective of quickly previewing it more completely.
The pandas package has a range of tools for parsing JSON data objects into regular tabular datasets known as dataframes (commonly referred to by the short form, df). A simple list of disctionaries can be cast to a dataframe by calling pd.DataFrame(LIST_OF_DICTS)
We will see later how more complex nested dictionaries of the form often generated from JSON data files can often be more conveniently parsed to a dataframe using the pandas.json_normalize() function.
# Parse the list of dicts data into a dataframe
groups_df = pd.DataFrame(groups_json)
# For more complex JSON objects,
# pd.json_normalize() may be more appropriate

# Just display the "head()" of the df; which is to say,
# just display the first few rows, in this case, 5
groups_df.head(5)
# Using .head() without specifying the number of lines is also valid.
| updatedAt | position | shortLabel | liveDisplay | reference | categoryGroupLangs | label | tinyLabel | refueling | promotionalDisplay | _bind | _origin | _id | _key | _updatedAt | _parent | color | |
|---|---|---|---|---|---|---|---|---|---|---|---|---|---|---|---|---|---|
| 0 | 2025-01-05T20:25:31+01:00 | 0 | cat.name.F_M | False | 2025-F-M | [{'locale': 'en', 'text': 'M1000 - Bike', 'var... | M | M | 0 | False | allGroups-2025 | categoryGroup-2025-F | ae6882fe1fcb5dbef0a7e42d7ca802c1 | label | 1737386137501 | category-2025:0a0fb4dfc03bcb6b0e9c940b5a09ae05 | NaN |
| 1 | 2025-01-05T20:25:31+01:00 | 1 | cat.name.F_Q | False | 2025-F-Q | [{'locale': 'en', 'text': 'M1000 - Quad', 'var... | Q | Q | 0 | False | allGroups-2025 | categoryGroup-2025-F | d02ea9bfe0a842c0650bba3c2cf33ecc | label | 1737386137501 | category-2025:0a0fb4dfc03bcb6b0e9c940b5a09ae05 | NaN |
| 2 | 2025-01-05T20:25:31+01:00 | 2 | cat.name.F_A | False | 2025-F-A | [{'variable': 'cat.name.F_A', 'text': 'M1000 -... | A | A | 0 | False | allGroups-2025 | categoryGroup-2025-F | d7cb4906cafa111859658683cf820133 | label | 1737386137501 | category-2025:0a0fb4dfc03bcb6b0e9c940b5a09ae05 | NaN |
| 3 | 2025-01-05T20:25:31+01:00 | 4 | cat.name.F_T5 | False | 2025-F-T5 | [{'variable': 'cat.name.F_T5', 'locale': 'en',... | T5 | C | 0 | False | allGroups-2025 | categoryGroup-2025-F | e0dcecc76fec5cd2cd095a09b821242d | label | 1737386137501 | category-2025:0a0fb4dfc03bcb6b0e9c940b5a09ae05 | NaN |
| 4 | 2025-01-05T20:25:31+01:00 | 3 | cat.name.F_T4 | False | 2025-F-T4 | [{'text': 'M1000 - SSV', 'variable': 'cat.name... | T4 | SSV | 0 | False | allGroups-2025 | categoryGroup-2025-F | f38a8e2eb62f13bc043106815cb187bd | label | 1737386137501 | category-2025:0a0fb4dfc03bcb6b0e9c940b5a09ae05 | NaN |
Skimming over the data, some of the columns don’t seem to provide information that looks to be immediately useful or useable. We can perhaps get a better feel for those columns by looking at the unique values that are contained within them:
groups_df['_key'].unique(), groups_df["promotionalDisplay"].unique(
), groups_df["refueling"].unique()
(array(['label'], dtype=object), array([False, True]), array([0]))
The _key column doesn’t seem to be useful at all — the only value provided is label, so no rows are distinguished from any other rows. The refueling column also appears to be less than informative. Let’s drop those columns, along with the updatedAt and _updatedAt columns.
In the following cell, we automate the dropping of the columns, somewhat. To begin with, we specify a list of columns we want to drop from the dataframe. We iterate through each of those in turn using the for ... in ... construction, which takes each list item in turn then applies the consequent operations using that column value.
The conditional if statement checks that the column name is one of the columns in the current dataframe — if we try to drop a column that is not in the current dataframe, we get an error. (Note that we could override such errors by setting .drop(..., errors="ignore") but I thought this might be a good opportunity to show how we can do a simple column existence check).
# Drop the _key column (axis=1) from the data frame
# Using inplace=True applies the modification directly to the dataframe
for c in ['_key', 'refueling', 'updatedAt', '_updatedAt']:
    if c in groups_df.columns:
        groups_df.drop(c, axis=1, inplace=True)
    # We could avoid the need for checking the existence
    # of the column names by using:
    # groups_df.drop(c, axis=1, inplace=True, errors="ignore")
I’m intrigued by the "promotionalDisplay" column. What might be special about the columns where that value is True?
We can select particular rows in a dataframe by passing in a Boolean index vector of True/False, retaining those rows with the True index selection value. As the "promotionalDisplay" column is a column of booleans, we can take that column of values (as groups_df["promotionalDisplay"]) and select rows in the groups_df on that basis:
# Use the boolean promotionalDisplay column values to
# index the selection of rows from the dataframe
groups_df[groups_df["promotionalDisplay"]]
# The returned rows will all have promotionalDisplay=True
| position | shortLabel | liveDisplay | reference | categoryGroupLangs | label | tinyLabel | promotionalDisplay | _bind | _origin | _id | _parent | color | |
|---|---|---|---|---|---|---|---|---|---|---|---|---|---|
| 5 | 4 | cat.name.A_T3 | True | 2025-A-T3 | [{'text': 'Challenger', 'locale': 'en', 'varia... | T3 | CHG | True | allGroups-2025 | categoryGroup-2025-A | 15f329900afa29e3e6b099ae681ebe12 | category-2025:63b4f5da4591200d0a4cc239245eb03a | #E04E39 |
| 6 | 5 | cat.name.A_T4 | True | 2025-A-T4 | [{'text': 'SSV', 'locale': 'en', 'variable': '... | T4 | SSV | True | allGroups-2025 | categoryGroup-2025-A | 423ea731fdcba5cda62c8334985889b0 | category-2025:63b4f5da4591200d0a4cc239245eb03a | #A7C6ED |
| 7 | 1 | cat.name.A_T2 | True | 2025-A-T2 | [{'locale': 'en', 'text': 'Stock', 'variable':... | T2 | STK | True | allGroups-2025 | categoryGroup-2025-A | 4dac064bf100bc806b91e7f2e7758297 | category-2025:63b4f5da4591200d0a4cc239245eb03a | #C7C9C7 |
| 8 | 0 | cat.name.A_T1 | True | 2025-A-T1 | [{'locale': 'en', 'variable': 'cat.name.A_T1',... | T1 | ULT | True | allGroups-2025 | categoryGroup-2025-A | b49155b3f5670d2a907aa01e319876b8 | category-2025:63b4f5da4591200d0a4cc239245eb03a | #EBBC4E |
| 9 | 6 | cat.name.A_T5 | True | 2025-A-T5 | [{'variable': 'cat.name.A_T5', 'text': 'Truck'... | T5 | TRK | True | allGroups-2025 | categoryGroup-2025-A | f1a437ac1135c9d9a5e33f5096f95259 | category-2025:63b4f5da4591200d0a4cc239245eb03a | #2D2926 |
| 16 | 0 | cat.name.M_GP | True | 2025-M-GP | [{'text': 'Rally GP', 'locale': 'en', 'variabl... | GP | GP | True | allGroups-2025 | categoryGroup-2025-M | 1e9e9ae28b6e9498ca39609d5e403992 | category-2025:e377e0f7b61dcf8217845dc4fac8cc5d | #EBBC4E |
| 17 | 1 | cat.name.M_R2 | True | 2025-M-R2 | [{'locale': 'en', 'variable': 'cat.name.M_R2',... | R2 | R2 | True | allGroups-2025 | categoryGroup-2025-M | eb1c119b536c526d5acea2a1e8a4d854 | category-2025:e377e0f7b61dcf8217845dc4fac8cc5d | #A7C6ED |
Presenting the data in the tabular form certainly makes it easier to review, at least, when viewed interactivley - print PDF documents are not so useful for previewing very wide tables. This data still doesn’t really feel very interesting, but it does provide labels that distinguish various categories of vehicle, so that may be useful.
It also looks like there may be some other possibly useful label information in the categoryGroupLangs is hard to read in that display. So let’s look at the contents of that categoryGroupLangs column by selecting just that column; and because the table has a large number of rows, let’s just preview the first 3 rows; and to simplify the display further, let’s cast the result to a list, which won’t be subject to any summarising dataframe display options preferred by the notebook cell output.
# Select a column, limit the display to the first three dataframe rows,
# and then display the single column, three row resulting df to a list
groups_df["categoryGroupLangs"][:3].to_list()
[[{'locale': 'en', 'text': 'M1000 - Bike', 'variable': 'cat.name.F_M'},
  {'text': 'M1000 - Moto', 'locale': 'fr', 'variable': 'cat.name.F_M'},
  {'locale': 'es', 'variable': 'cat.name.F_M', 'text': 'M1000 - Moto'},
  {'variable': 'cat.name.F_M', 'text': 'M1000 - Bike', 'locale': 'ar'}],
 [{'locale': 'en', 'text': 'M1000 - Quad', 'variable': 'cat.name.F_Q'},
  {'text': 'M1000 - Quad', 'variable': 'cat.name.F_Q', 'locale': 'fr'},
  {'text': 'M1000 - Quad', 'locale': 'es', 'variable': 'cat.name.F_Q'},
  {'text': 'M1000 - Quad', 'variable': 'cat.name.F_Q', 'locale': 'ar'}],
 [{'variable': 'cat.name.F_A', 'text': 'M1000 - Car', 'locale': 'en'},
  {'text': 'M1000 - Auto', 'variable': 'cat.name.F_A', 'locale': 'fr'},
  {'text': 'M1000 - Coche', 'locale': 'es', 'variable': 'cat.name.F_A'},
  {'variable': 'cat.name.F_A', 'locale': 'ar', 'text': 'M1000 - Car'}]]
What we see here is that we appear to have several different language labels associated with each row. It might be useful if we could somehow “bend” those values into different language columns.
This is another area where the pandas package comes into its own. But first, let’s think through what we need to do. In each row of the table, the categoryGroupLangs cell contains a list of dictionaries. Each dictionary has a variable, (which by inspection of the dataframe seems to match the shortLabel column value in the dataframe); the locale specfies a language code, and the text is a description of the vehicle type.
If we explode() the categoryGroupLangs column, we can unpack the list in each cell and generate one row for each list item. This produces a pandas.Series datatype; each index value in the Series matches the index value of the parent row in the dataframe that was exploded to form that Series row.
groups_df["categoryGroupLangs"].explode()
0     {'locale': 'en', 'text': 'M1000 - Bike', 'vari...
0     {'text': 'M1000 - Moto', 'locale': 'fr', 'vari...
0     {'locale': 'es', 'variable': 'cat.name.F_M', '...
0     {'variable': 'cat.name.F_M', 'text': 'M1000 - ...
1     {'locale': 'en', 'text': 'M1000 - Quad', 'vari...
                            ...
16    {'locale': 'ar', 'variable': 'cat.name.M_GP', ...
17    {'locale': 'en', 'variable': 'cat.name.M_R2', ...
17    {'text': 'Rally 2', 'locale': 'fr', 'variable'...
17    {'variable': 'cat.name.M_R2', 'text': 'Rally 2...
17    {'text': 'رالي 2', 'variable': 'cat.name.M_R2'...
Name: categoryGroupLangs, Length: 72, dtype: object
We can map the dictionary in each row of the Series to a dataframe row by using the pd.json_normalize() function. Note that this resets the index values, so at this point we have lost an index based mapping back to the original dataframe rows.
category_langs_df = pd.json_normalize(
    groups_df["categoryGroupLangs"].explode())
category_langs_df
| locale | text | variable | |
|---|---|---|---|
| 0 | en | M1000 - Bike | cat.name.F_M |
| 1 | fr | M1000 - Moto | cat.name.F_M |
| 2 | es | M1000 - Moto | cat.name.F_M |
| 3 | ar | M1000 - Bike | cat.name.F_M |
| 4 | en | M1000 - Quad | cat.name.F_Q |
| ... | ... | ... | ... |
| 67 | ar | رالي GP | cat.name.M_GP |
| 68 | en | Rally 2 | cat.name.M_R2 |
| 69 | fr | Rally 2 | cat.name.M_R2 |
| 70 | es | Rally 2 | cat.name.M_R2 |
| 71 | ar | رالي 2 | cat.name.M_R2 |
72 rows × 3 columns
Another way of reaching the same result is to parse the nested categoryGroupLangs dictionary in each original JSON record using the pd.json_normalize() function:
# Parse a specified path in the original JSON data records
pd.json_normalize(groups_json, record_path="categoryGroupLangs")
| locale | text | variable | |
|---|---|---|---|
| 0 | en | M1000 - Bike | cat.name.F_M |
| 1 | fr | M1000 - Moto | cat.name.F_M |
| 2 | es | M1000 - Moto | cat.name.F_M |
| 3 | ar | M1000 - Bike | cat.name.F_M |
| 4 | en | M1000 - Quad | cat.name.F_Q |
| ... | ... | ... | ... |
| 67 | ar | رالي GP | cat.name.M_GP |
| 68 | en | Rally 2 | cat.name.M_R2 |
| 69 | fr | Rally 2 | cat.name.M_R2 |
| 70 | es | Rally 2 | cat.name.M_R2 |
| 71 | ar | رالي 2 | cat.name.M_R2 |
72 rows × 3 columns
Inspection of this data shows it to be in a long format, with each row having a very simple structure.
We note from repeated variable values across the rows that we have different locale/text labels for the same variable value. This suggests that it may be more informative to view the data in a wide format, where each row includes the values for each language label for a given variable value.
# Wrapping the code in brackets is a syntactic trick that
# allows us to fettle the presentation of the code,
# splitting dot separated components out onto separate lines
categoryGroupLangs_wide = (
    pd.json_normalize(
        groups_df["categoryGroupLangs"].explode())
    .pivot(
        index='variable',
        columns='locale',
        values='text',
    )
    .reset_index()
)

categoryGroupLangs_wide
| locale | variable | ar | en | es | fr |
|---|---|---|---|---|---|
| 0 | cat.name.A_T1 | Ultimate | Ultimate | Ultimate | Ultimate |
| 1 | cat.name.A_T2 | Stock | Stock | Stock | Stock |
| 2 | cat.name.A_T3 | Challenger | Challenger | Challenger | Challenger |
| 3 | cat.name.A_T4 | SSV | SSV | SSV | SSV |
| 4 | cat.name.A_T5 | شاحنة | Truck | Camión | Camion |
| 5 | cat.name.F_A | M1000 - Car | M1000 - Car | M1000 - Coche | M1000 - Auto |
| 6 | cat.name.F_M | M1000 - Bike | M1000 - Bike | M1000 - Moto | M1000 - Moto |
| 7 | cat.name.F_Q | M1000 - Quad | M1000 - Quad | M1000 - Quad | M1000 - Quad |
| 8 | cat.name.F_T4 | M1000 - SSV | M1000 - SSV | M1000 - SSV | M1000 - SSV |
| 9 | cat.name.F_T5 | M1000 - Truck | M1000 - Truck | M1000 - Camión | M1000 - Camion |
| 10 | cat.name.K_H1 | Classic Auto (Low average) | Classic Auto (Low average) | Classic Auto (Media Baja) | Classic Auto (Moyenne Basse) |
| 11 | cat.name.K_H1T | Classic Truck (Low average) | Classic Truck (Low average) | Classic Truck (Media Baja) | Classic Truck (Moyenne Basse) |
| 12 | cat.name.K_H2 | Classic Auto (moderate average) | Classic Auto (moderate average) | Classic Auto (Media moderada) | Classic Auto (Moyenne moyenne) |
| 13 | cat.name.K_H2T | Classic Truck (moderate average) | Classic Truck (moderate average) | Classic Truck (Media moderada) | Classic Truck (Moyenne moyenne) |
| 14 | cat.name.K_H3 | Classic Auto (intermediate average) | Classic Auto (intermediate average) | Classic Auto (Media intermedia) | Classic Auto (Moyenne intermédiaire) |
| 15 | cat.name.K_H4 | Classic Auto (high average) | Classic Auto (high average) | Classic Auto (Media de alta) | Classic Auto (Moyenne haute) |
| 16 | cat.name.M_GP | رالي GP | Rally GP | Rally GP | Rally GP |
| 17 | cat.name.M_R2 | رالي 2 | Rally 2 | Rally 2 | Rally 2 |
Recalling that the variable values match the shortLabel value in the original dataframe, we can merge categoryGroupLangs_wide columns back into groups_df dataframe based on matching variable/shortLabel values:
# Merge the original dataframe and the derived wide data frame
# using matching values across the shortLabel and variable columns
groups_df = pd.merge(groups_df, categoryGroupLangs_wide,
                     left_on="shortLabel", right_on='variable')

# Drop the redundant categoryGroupLangs and variable columns
groups_df.drop("categoryGroupLangs", axis=1, inplace=True)
groups_df.drop("variable", axis=1, inplace=True)

# View the column headers of the new dataframe
groups_df.columns
Index(['position', 'shortLabel', 'liveDisplay', 'reference', 'label',
       'tinyLabel', 'promotionalDisplay', '_bind', '_origin', '_id', '_parent',
       'color', 'ar', 'en', 'es', 'fr'],
      dtype='object')
The new groups_df dataframe now includes columns for the various language labels for each category.
Loading the Data from a Single Line of Code#
The previous sections show how we can build up a series of steps that request a data feed from the Dakar rally live data site and then manipulate the data until we get it into a form we are happy with.
We can also bundle these steps into one or more functions inside a package of our own creation to make it easier to distribute and use these functions.
Adding the groups Data to a Database#
Loading the data “live