12 SS17 Montim
A quick review of the stage, detailing the overall route, the route in 1km sections, route elevation profile and route curvature profile.
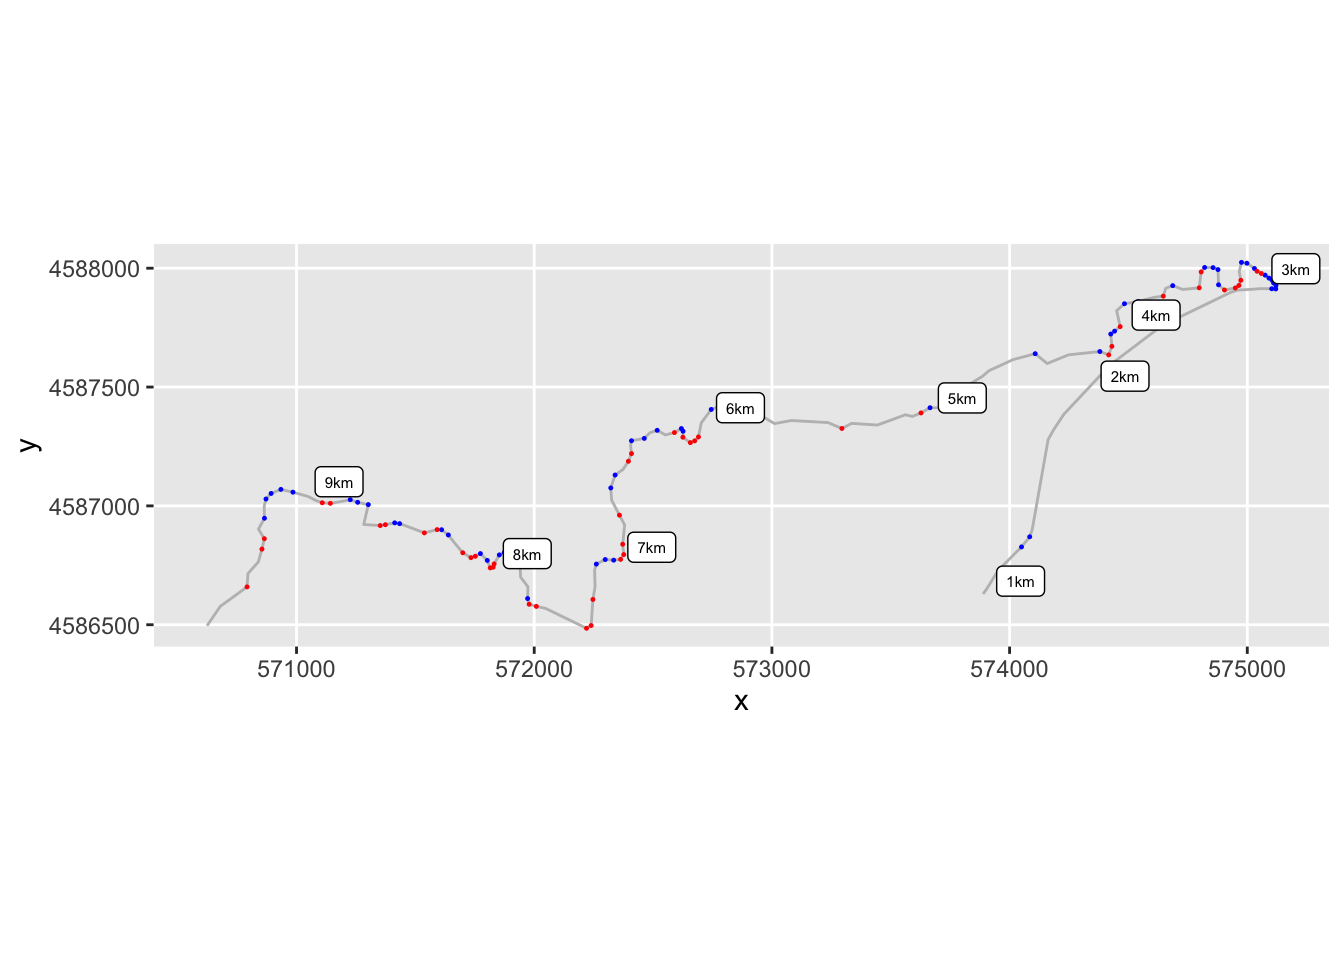
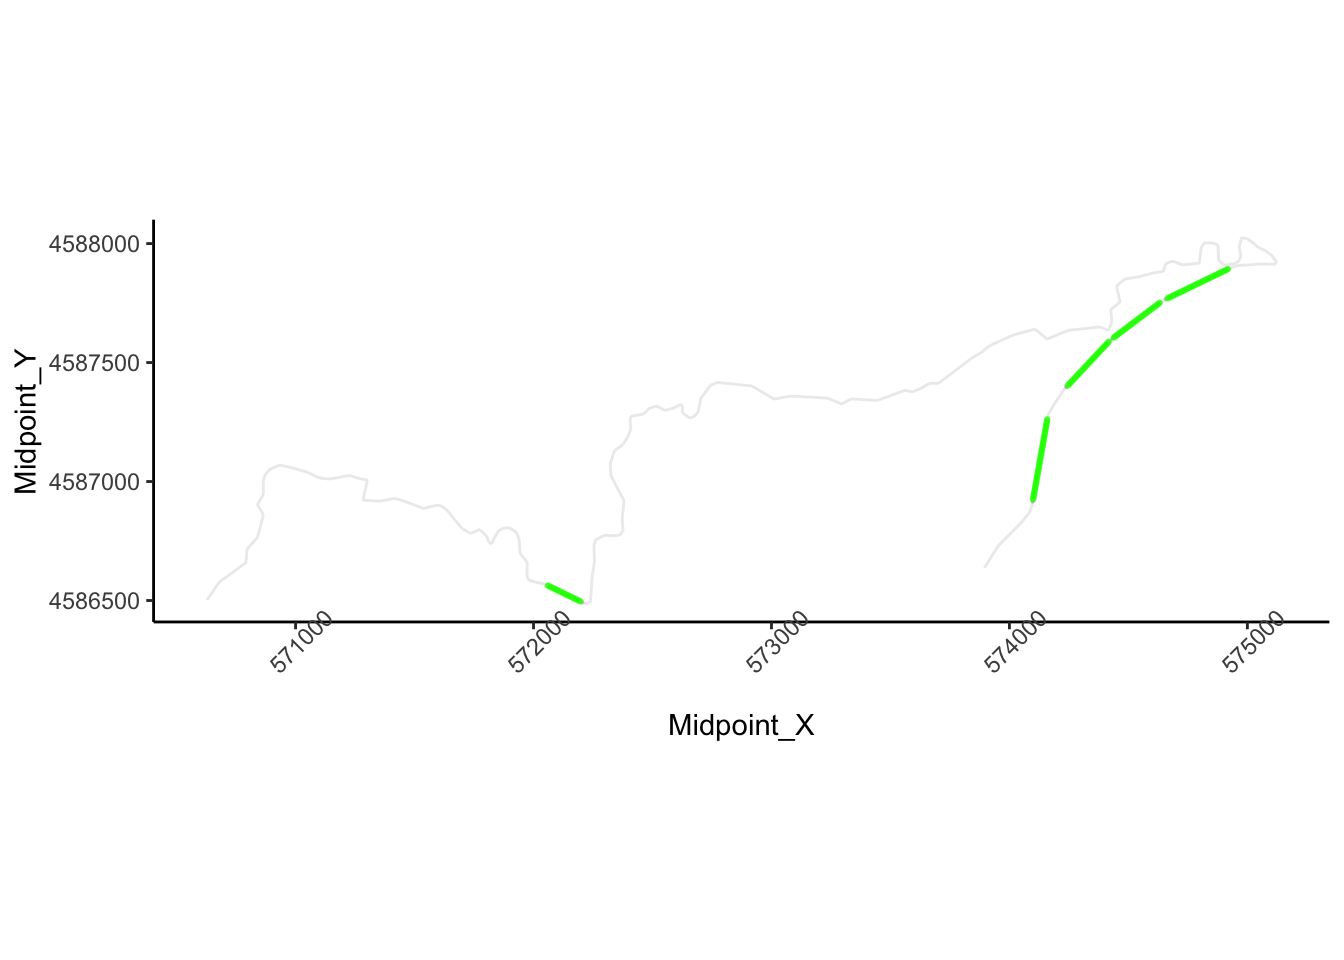
12.1 Stage Route Preview
Static map, significant corners highlighted:
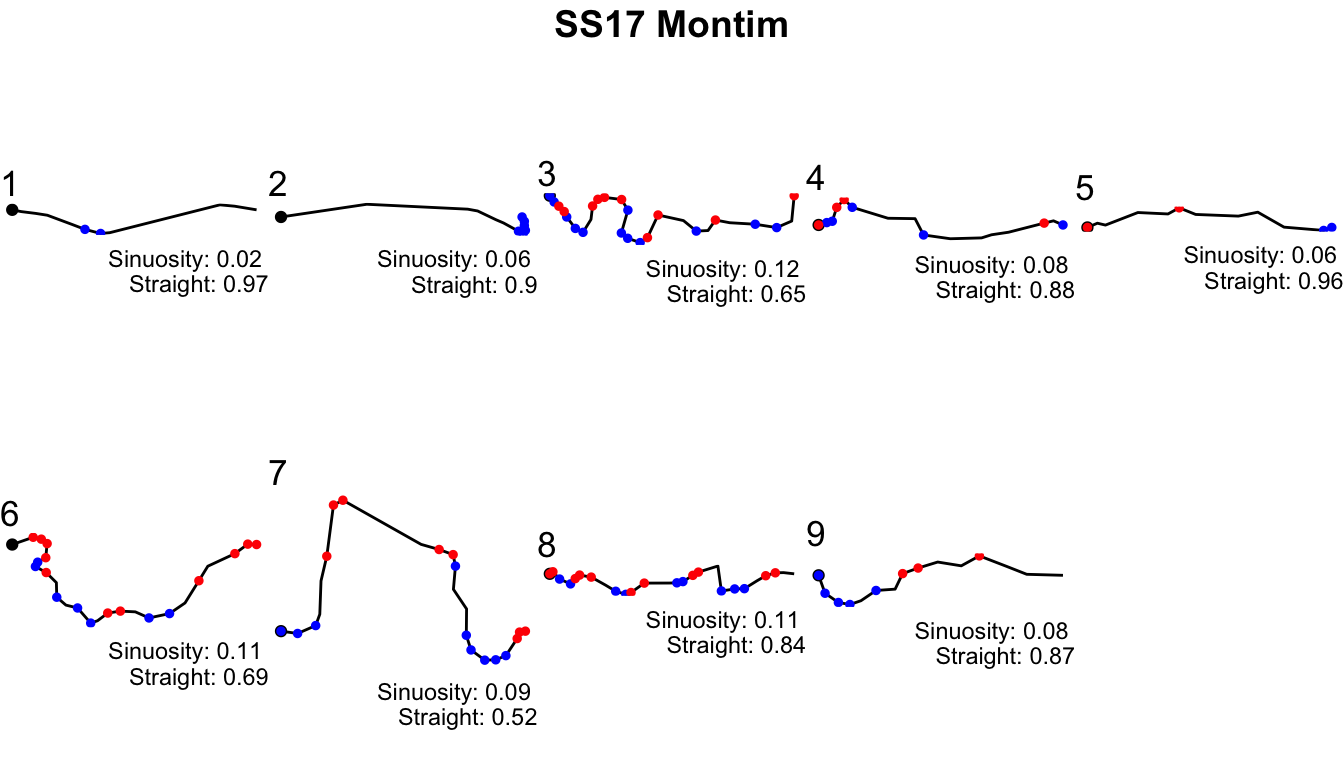
12.2 Segmented Route
1km route sections, aligned to read left to right; significant corners highlighted.
12.3 Speed Estimates
Estimates of speed along the route according to a very simple acceleration model.
Kilometer section speeds (kmtime is time in seconds to complete that segment; avspeed is in km/h):
| kmsection | section_length | km_time | av_speed | maxspeed |
|---|---|---|---|---|
| 1 | 0.99 | 27.10820 | 131.47313 | 145.0000 |
| 2 | 1.00 | 31.81896 | 113.14008 | 145.0000 |
| 3 | 1.00 | 47.49997 | 75.78952 | 144.9968 |
| 4 | 1.00 | 35.15193 | 102.41259 | 145.0000 |
| 5 | 1.00 | 31.69827 | 113.57088 | 145.0000 |
| 6 | 1.00 | 44.60614 | 80.70637 | 144.8730 |
| 7 | 1.00 | 40.28971 | 89.35284 | 145.0000 |
| 8 | 1.00 | 44.47962 | 80.93595 | 144.9634 |
| 9 | 0.80 | 28.18265 | 102.19054 | 145.0000 |
Anticipated stage time: 5m 30.8s
Speed profile chart: this chart shows the anticipated speed over distance into route on a per kilometer basis (the green area is flat out, the pink is the sort of slow you see at a hairpin):
12.4 Elevation and Convexity Index into Route
Elevation and significant curvature vs distance into stage:
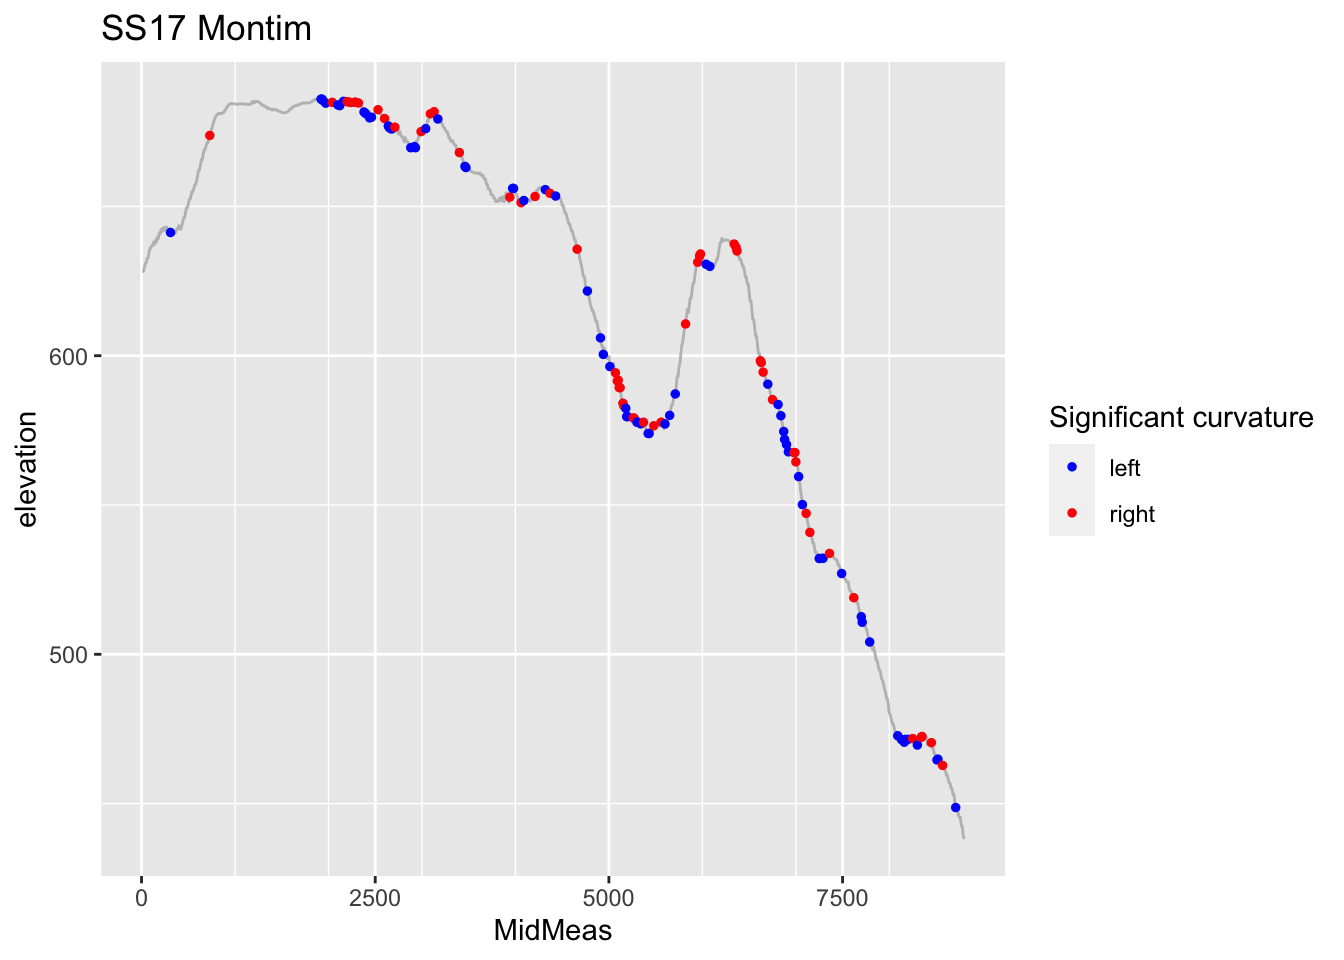
(Note that this uses a different curvature measure to the route plots; specifically, the curvature measure used here is the convexity index.)
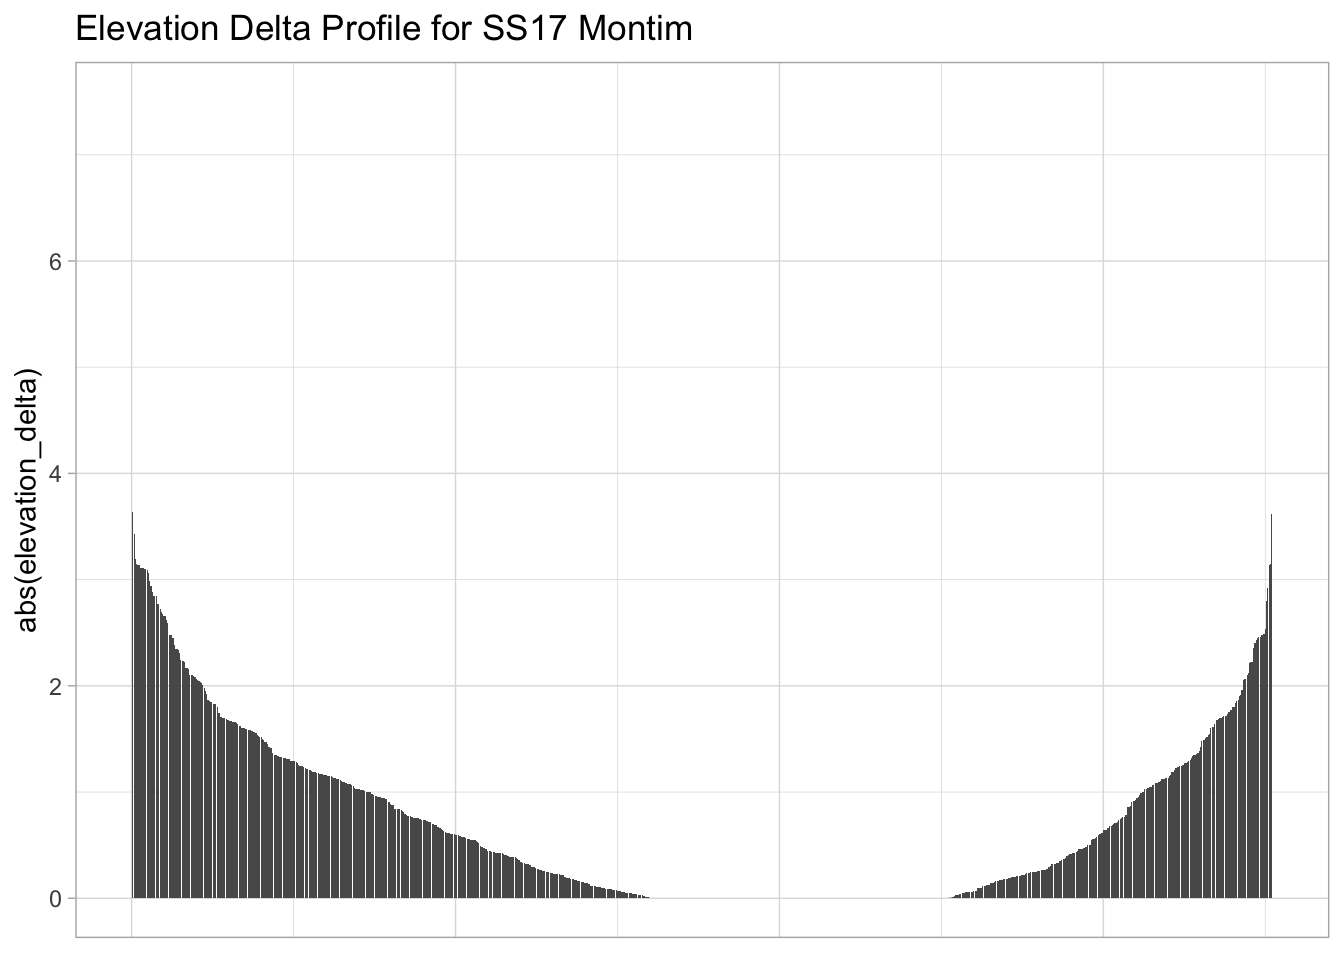
Elevation delta signature — order the severity of height changes over each 10m section of the stage:
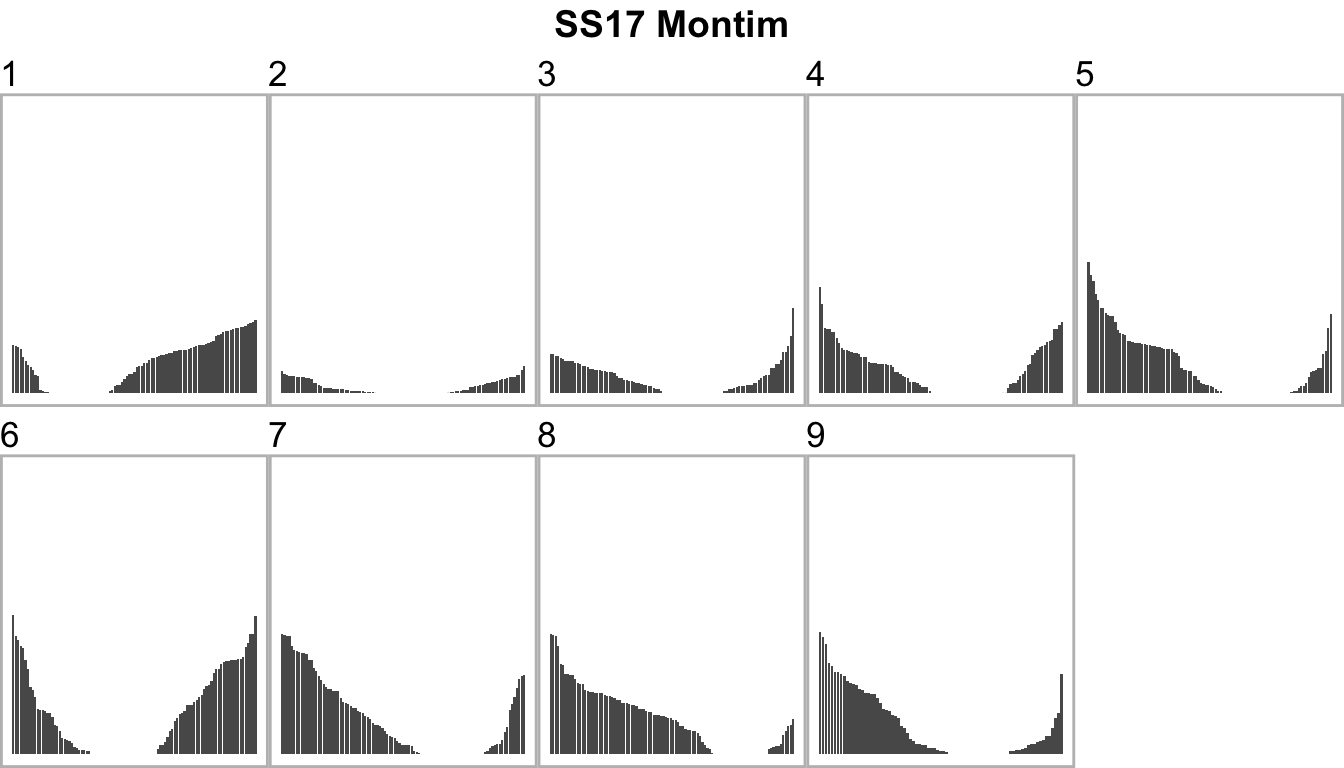
Split section elevation delta signatures:
12.4.1 Left and Right
How does the stage vary in terms of left and right turns?
Order the severity of right and left turns over each 10m section of the stage:
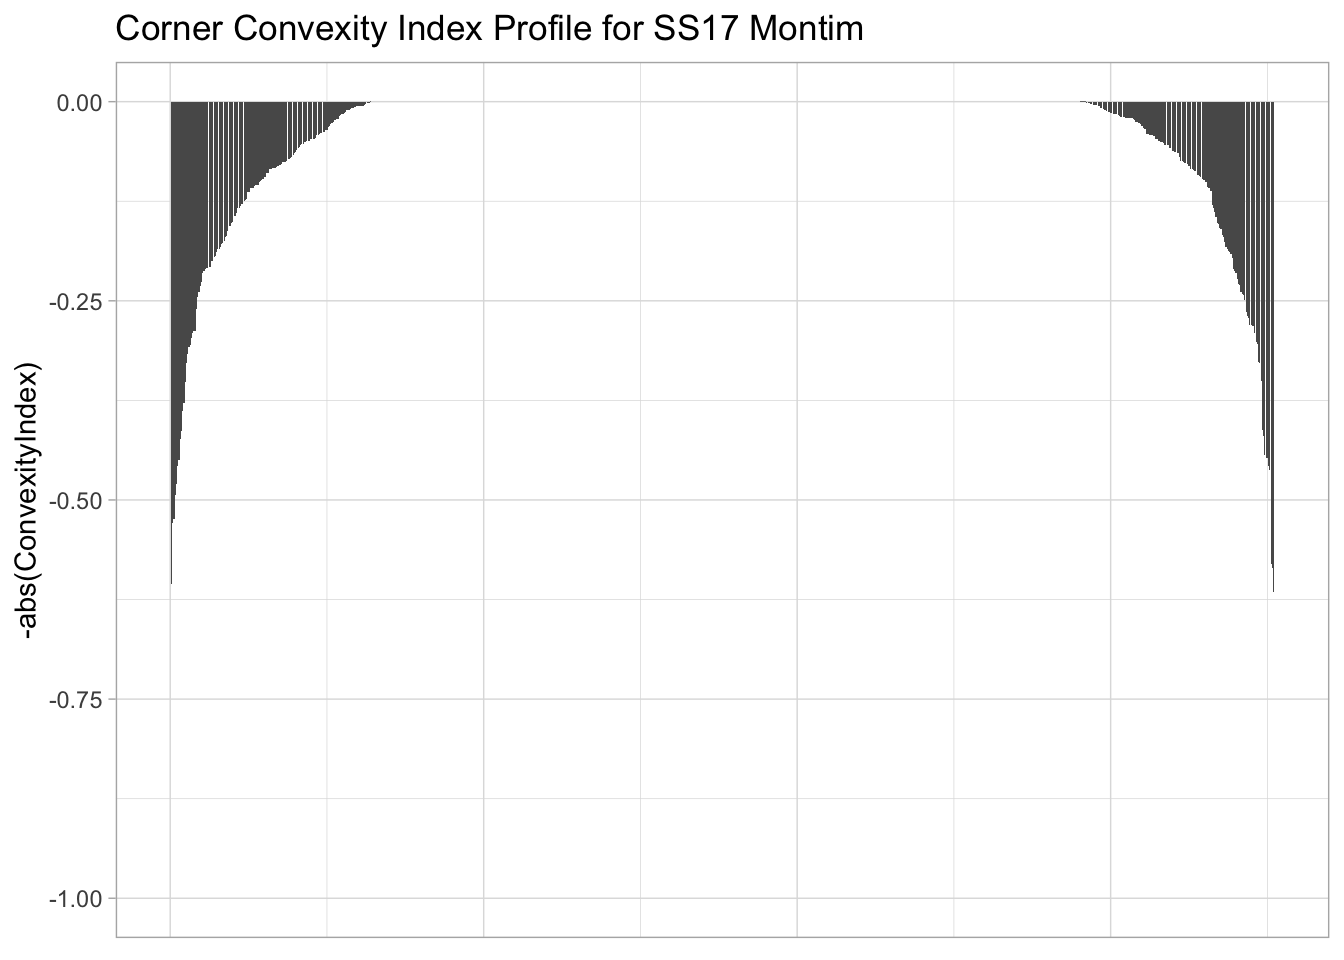
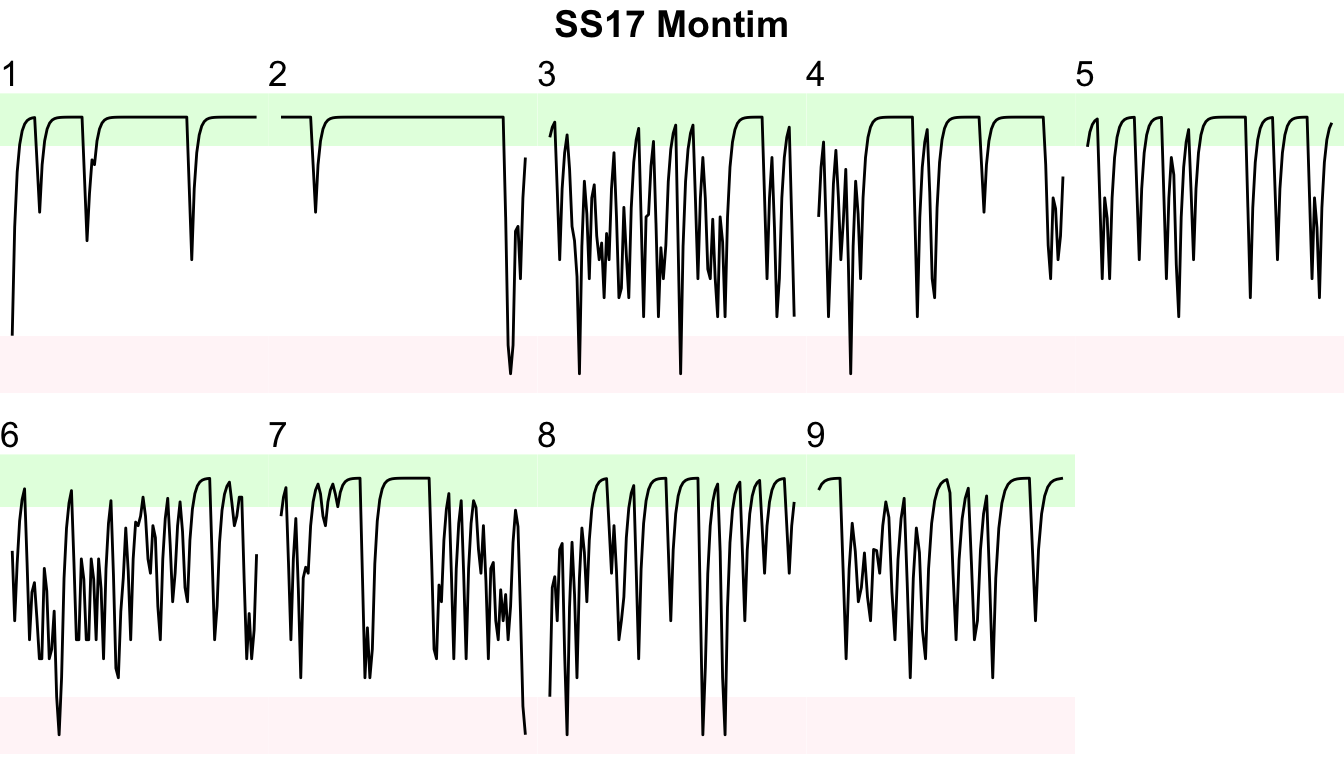
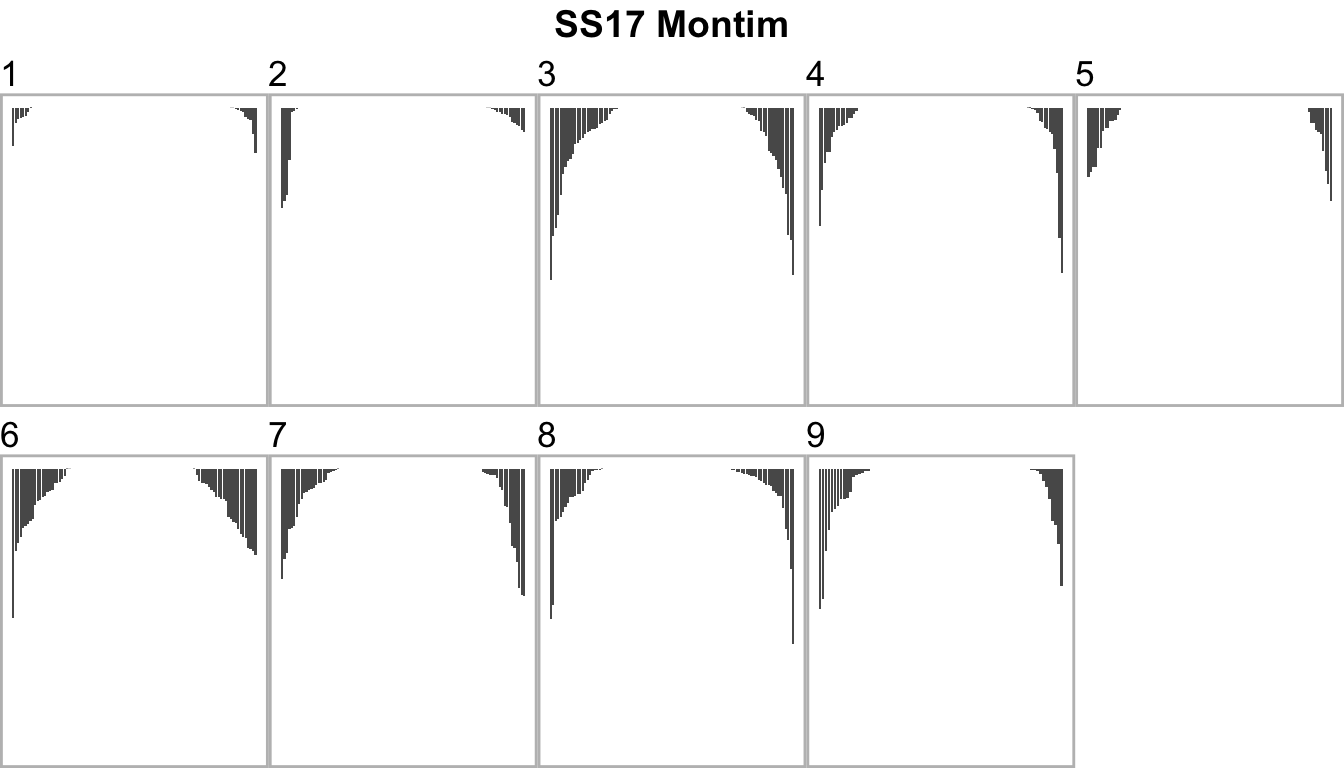
Kilometer segment convexity index signatures:
| Distance into stage (km) | Straight length (m) |
|---|---|
| 6.38 | 170 |
| 1.43 | 300 |
| 1.15 | 260 |
| 0.87 | 270 |
| 0.36 | 360 |
12.4.2 Sinuosity and Straightness
Sinuosity and straightness are technical measures with specific defintions. They may or may not be that useful for route analysis in their current form. The intention is to try to find ways of identifying variously “interesting” kilometer stretches.
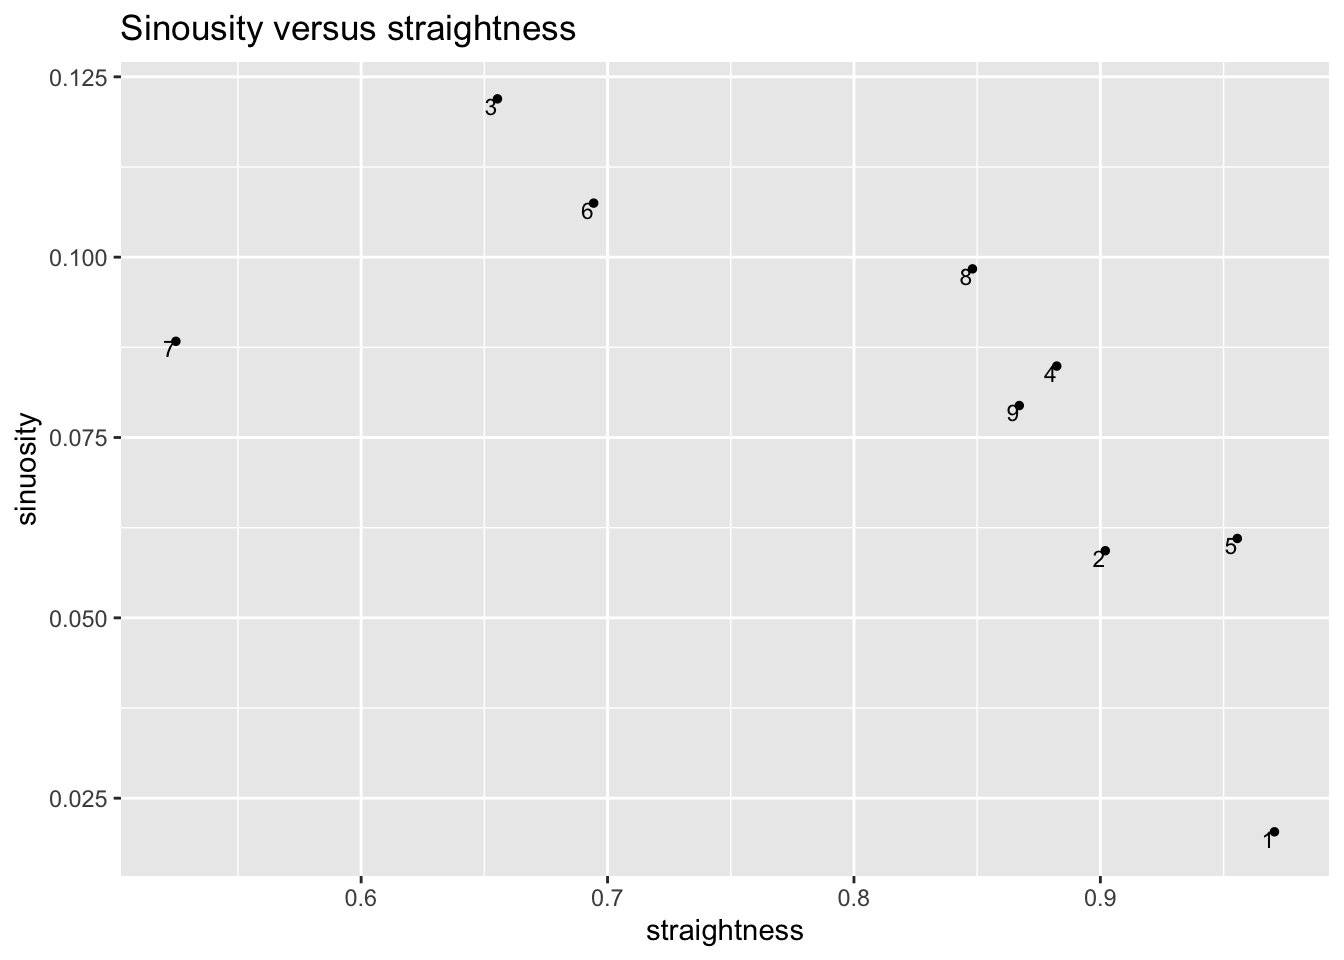
| km | sinuosity | straightness | route |
|---|---|---|---|
| 1 | 0.02033932 | 0.9706522 |

|
| 2 | 0.05930612 | 0.9020038 |

|
| 3 | 0.12194841 | 0.6553316 |

|
| 4 | 0.08490402 | 0.8823044 |

|
| 5 | 0.06100314 | 0.9555856 |

|
| 6 | 0.10749322 | 0.6943704 |

|
| 7 | 0.08833793 | 0.5248222 |

|
| 8 | 0.09837720 | 0.8481031 |

|
| 9 | 0.07943059 | 0.8670943 |

|