1 SD
A quick review of the stage, detailing the overall route, the route in 1km sections, route elevation profile and route curvature profile.
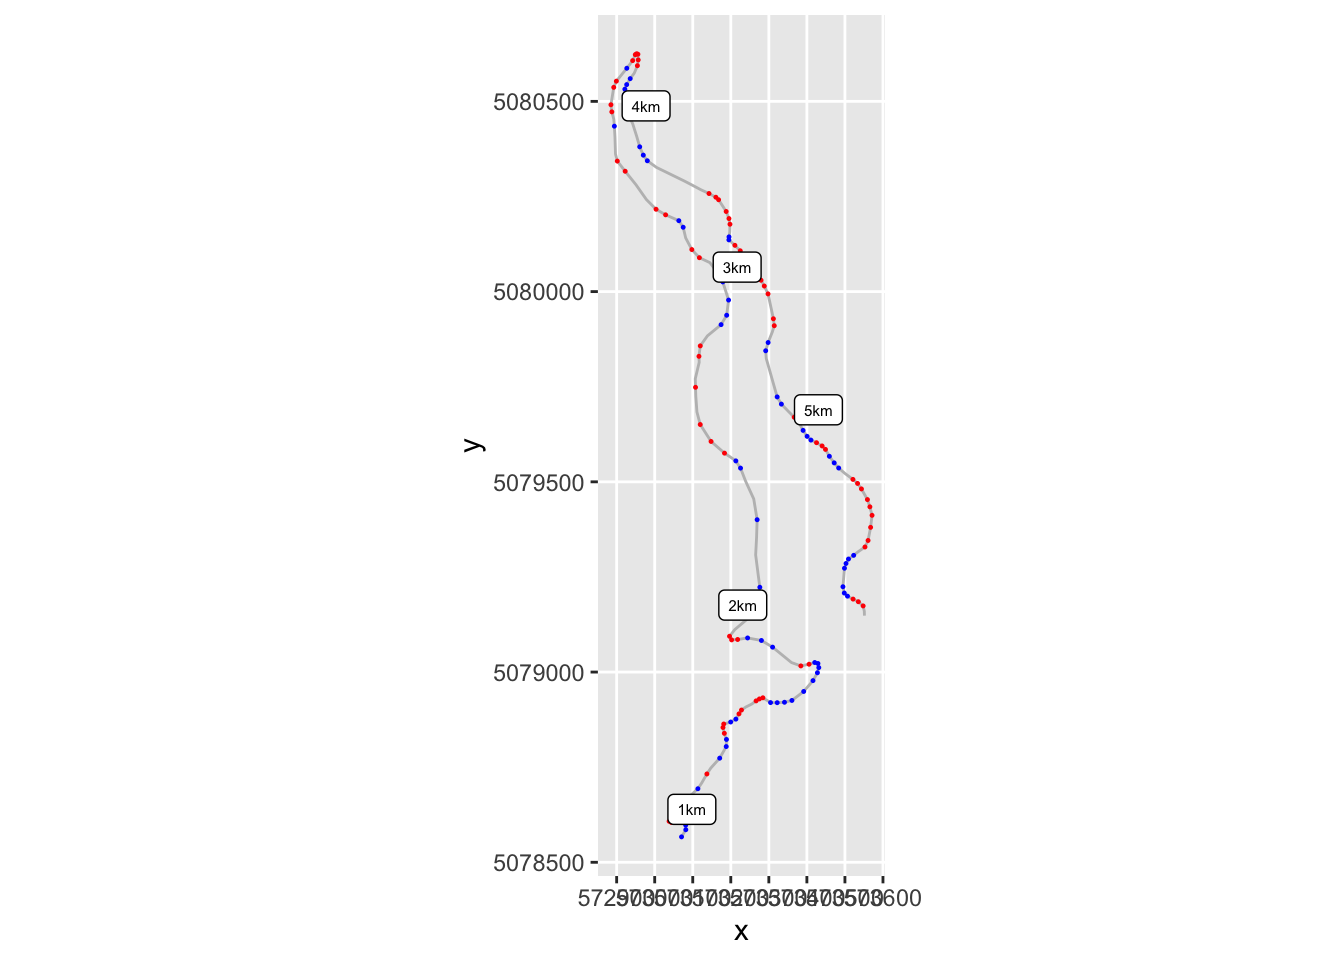
1.1 Stage Route Preview
Static map, significant corners highlighted:
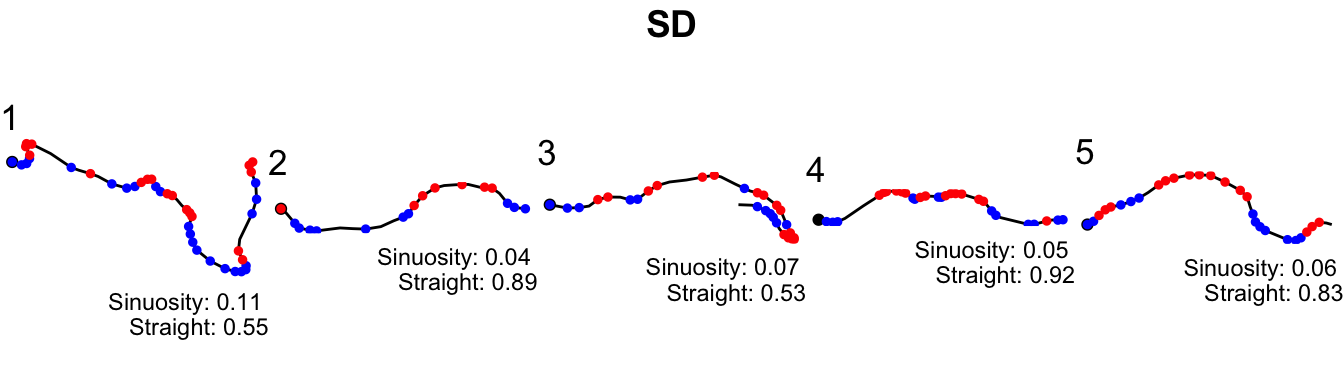
1.2 Segmented Route
1km route sections, aligned to read left to right; significant corners highlighted.
1.3 Speed Estimates
Estimates of speed along the route according to a very simple acceleration model.
Kilometer section speeds (kmtime is time in seconds to complete that kilometer; avspeed is in km/h):
| kmsection | km_time | av_speed | maxspeed |
|---|---|---|---|
| 1 | 52.67650 | 68.34167 | 144.7070 |
| 2 | 31.04084 | 115.97624 | 144.9817 |
| 3 | 39.26294 | 91.68951 | 144.9969 |
| 4 | 31.10682 | 115.73024 | 144.9999 |
| 5 | 21.08685 | 170.72252 | 145.0000 |
Anticipated stage time: 2m 55.2s
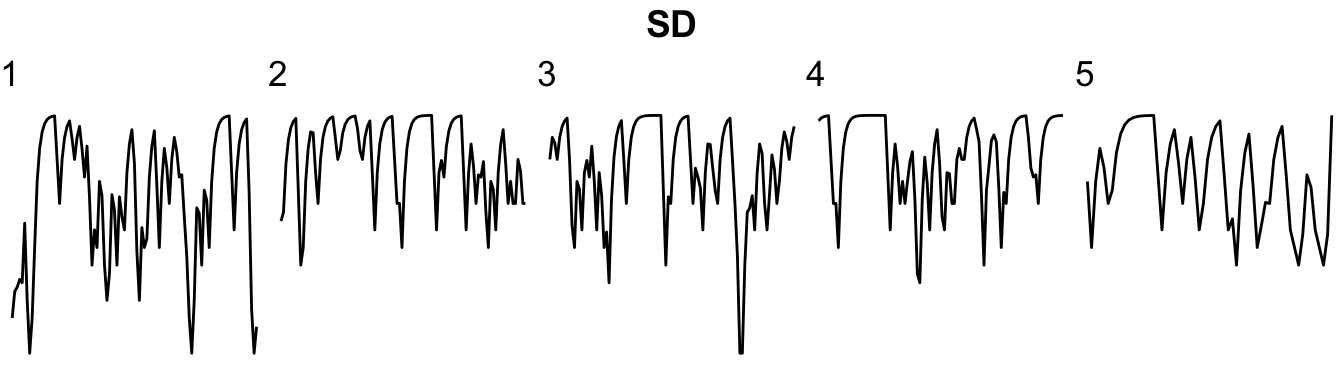
Speed profile chart: this chart shows the anticipated speed over distance into route on a per kilometer basis:
1.4 Elevation and Convexity Index into Route
Elevation and significant curvature vs distance into stage:
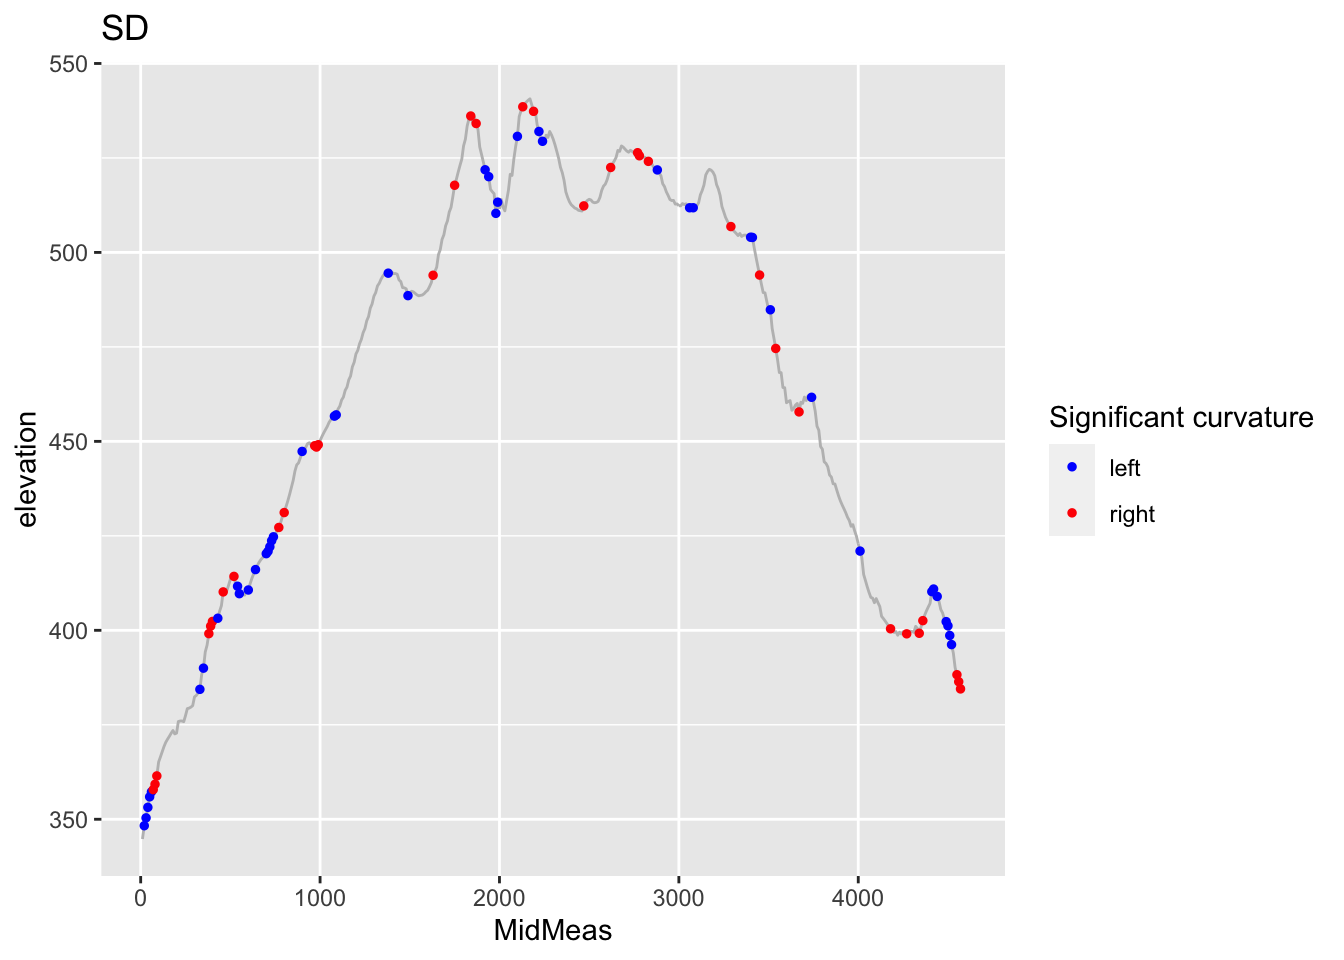
(Note that this uses a different curvature measure to the route plots; specifically, the curvature measure used here is the convexity index.)
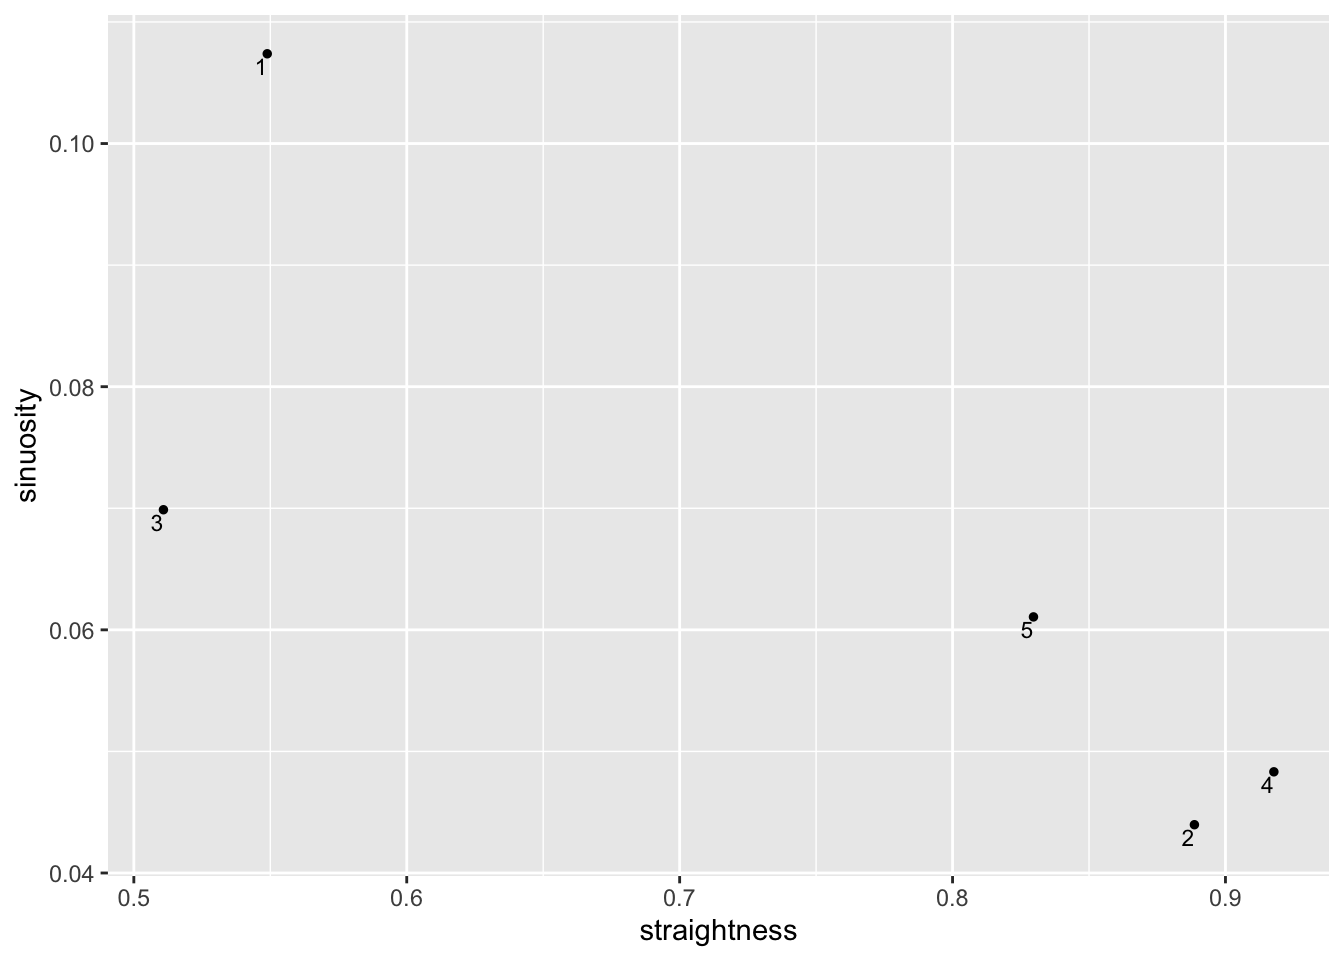
| km | sinuosity | straightness | route |
|---|---|---|---|
| 1 | 0.10738434 | 0.5488834 |

|
| 2 | 0.04397120 | 0.8886209 |

|
| 3 | 0.06987947 | 0.5108444 |

|
| 4 | 0.04832234 | 0.9177364 |

|
| 5 | 0.06106443 | 0.8296505 |

|