9 SS12-16 Vinski Vrh - Duga Resa
A quick review of the stage, detailing the overall route, the route in 1km sections, route elevation profile and route curvature profile.
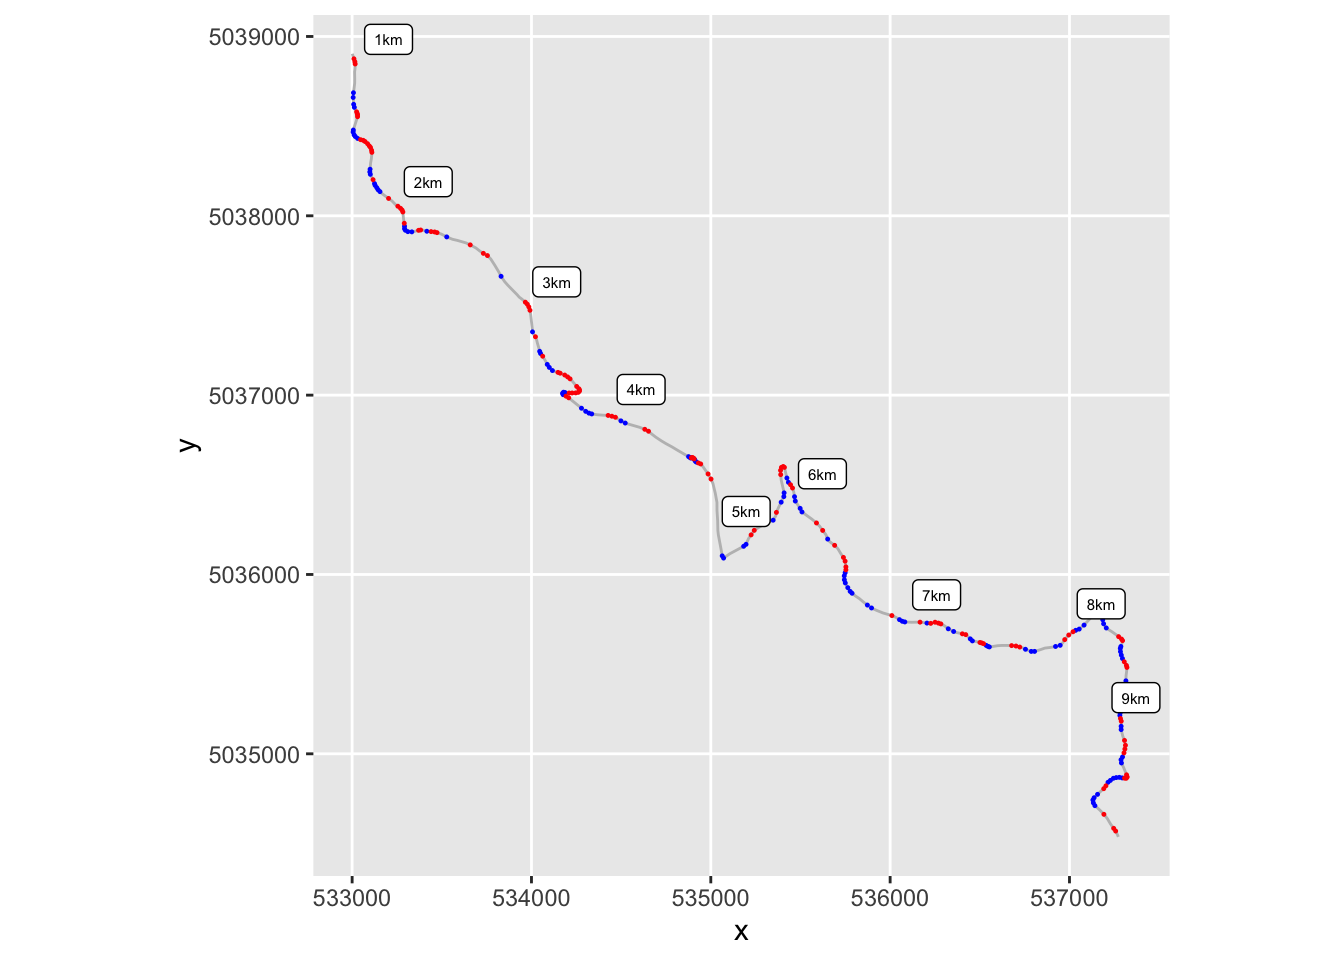
9.1 Stage Route Preview
Static map, significant corners highlighted:
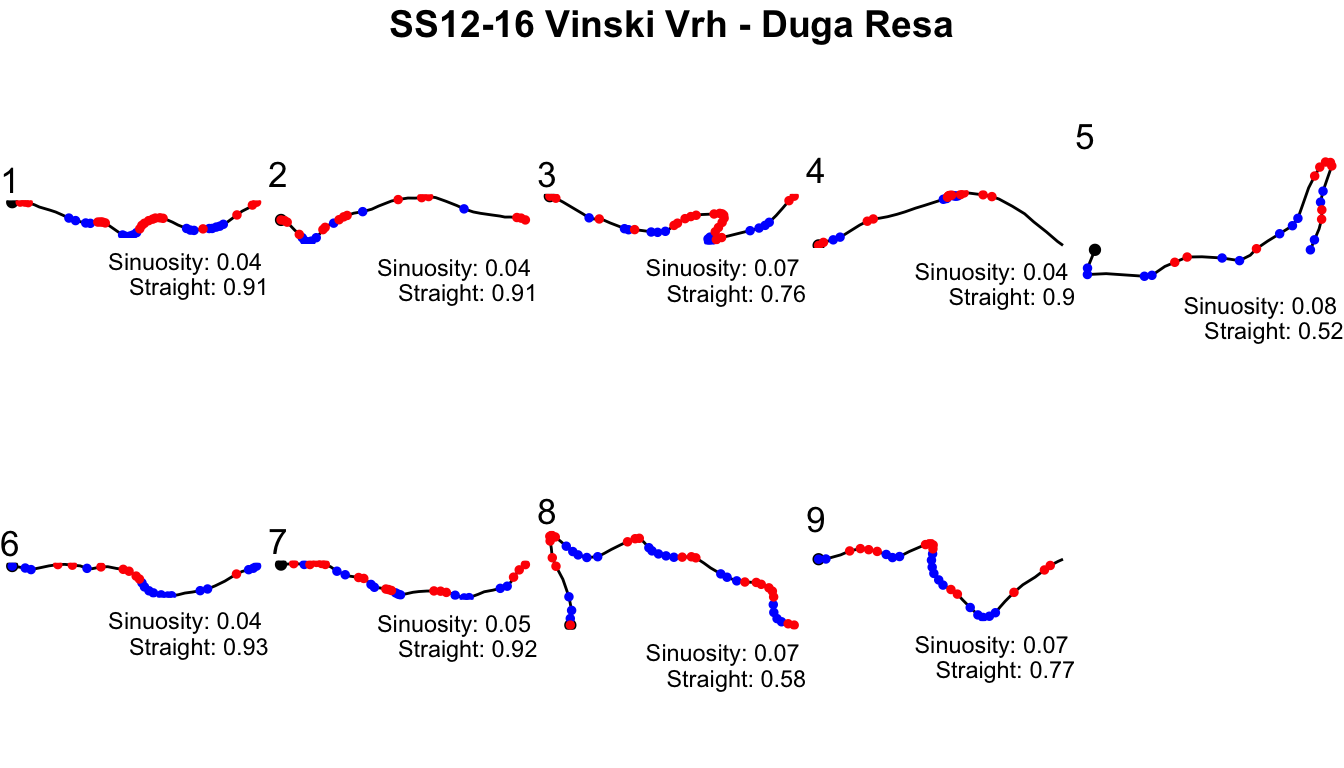
9.2 Segmented Route
1km route sections, aligned to read left to right; significant corners highlighted.
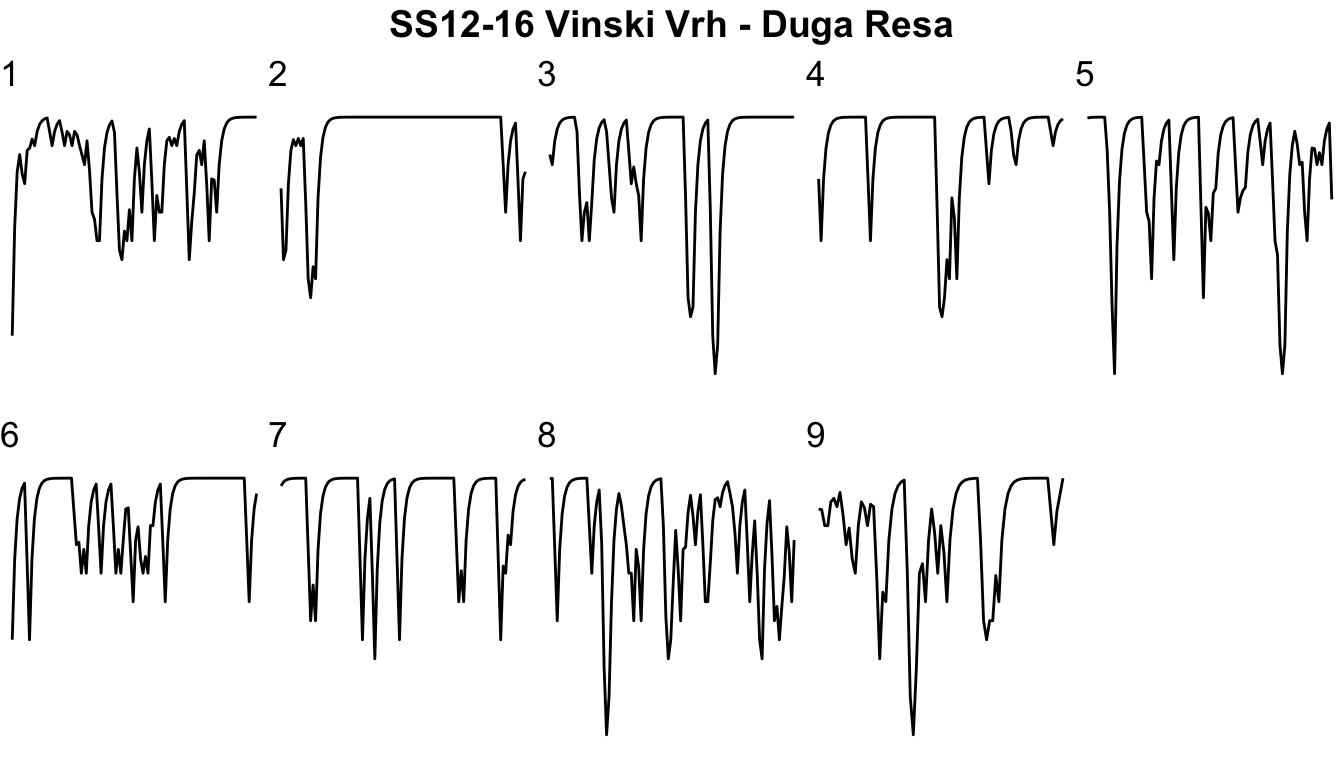
9.3 Speed Estimates
Estimates of speed along the route according to a very simple acceleration model.
Kilometer section speeds (kmtime is time in seconds to complete that kilometer; avspeed is in km/h):
| kmsection | km_time | av_speed | maxspeed |
|---|---|---|---|
| 1 | 31.22374 | 115.29688 | 144.9992 |
| 2 | 28.09509 | 128.13626 | 145.0000 |
| 3 | 34.90373 | 103.14084 | 145.0000 |
| 4 | 29.23020 | 123.16031 | 145.0000 |
| 5 | 40.05881 | 89.86786 | 144.9963 |
| 6 | 29.26566 | 123.01105 | 145.0000 |
| 7 | 29.49119 | 122.07033 | 145.0000 |
| 8 | 38.59969 | 93.26501 | 144.9817 |
| 9 | 30.14143 | 119.43694 | 145.0000 |
Anticipated stage time: 4m 51s
Speed profile chart: this chart shows the anticipated speed over distance into route on a per kilometer basis:
9.4 Elevation and Convexity Index into Route
Elevation and significant curvature vs distance into stage:
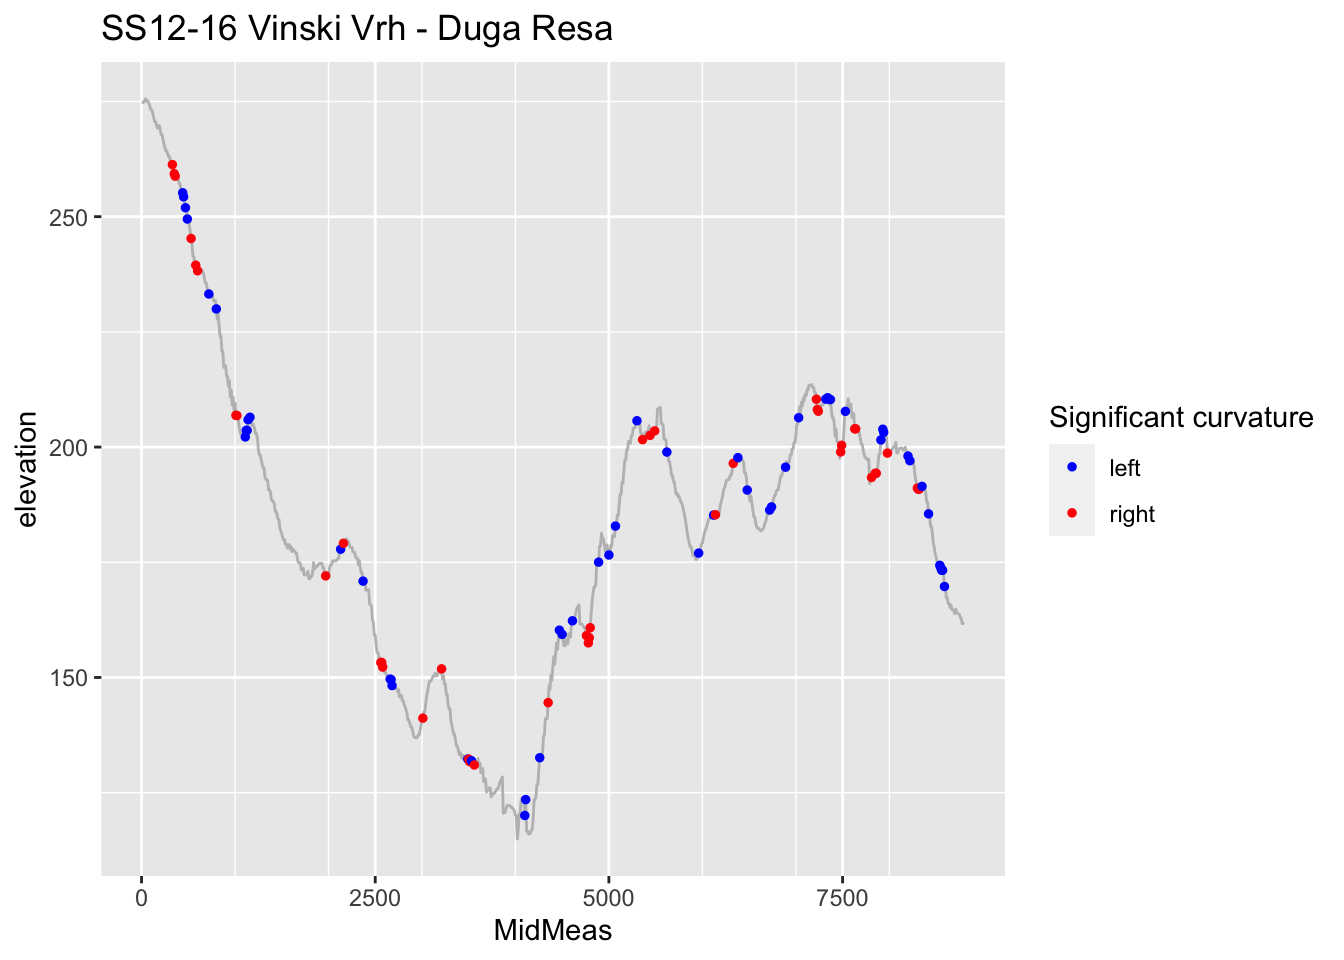
(Note that this uses a different curvature measure to the route plots; specifically, the curvature measure used here is the convexity index.)
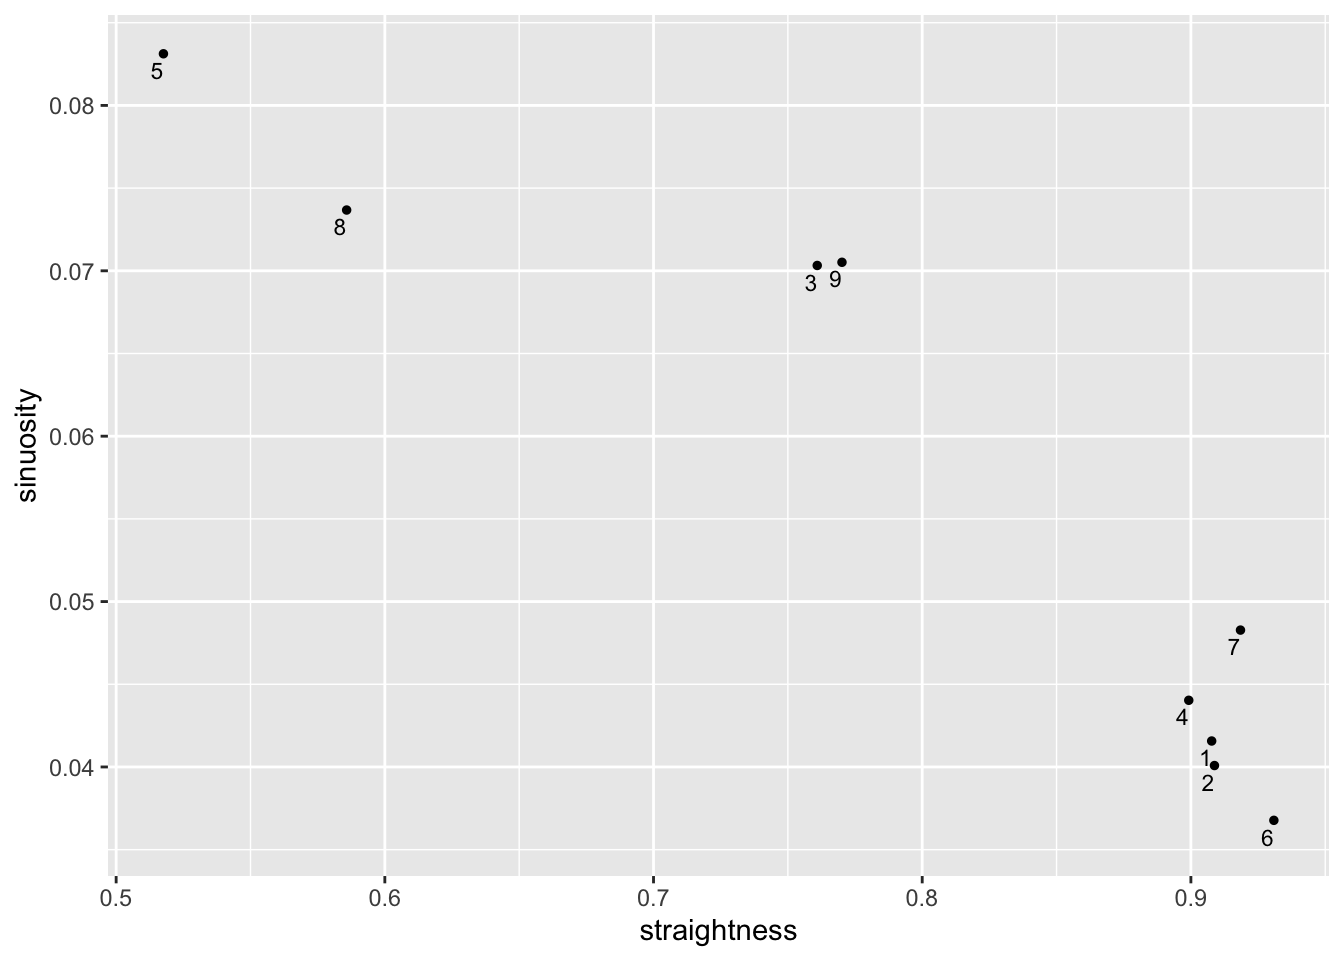
| km | sinuosity | straightness | route |
|---|---|---|---|
| 1 | 0.04156970 | 0.9077319 |

|
| 2 | 0.04008623 | 0.9087710 |

|
| 3 | 0.07032332 | 0.7609303 |

|
| 4 | 0.04403159 | 0.8992064 |

|
| 5 | 0.08312318 | 0.5175997 |

|
| 6 | 0.03677306 | 0.9308806 |

|
| 7 | 0.04827587 | 0.9184575 |

|
| 8 | 0.07367487 | 0.5857866 |

|
| 9 | 0.07051541 | 0.7701394 |

|