8 SS11-15 Krašić - Vrškovac
A quick review of the stage, detailing the overall route, the route in 1km sections, route elevation profile and route curvature profile.
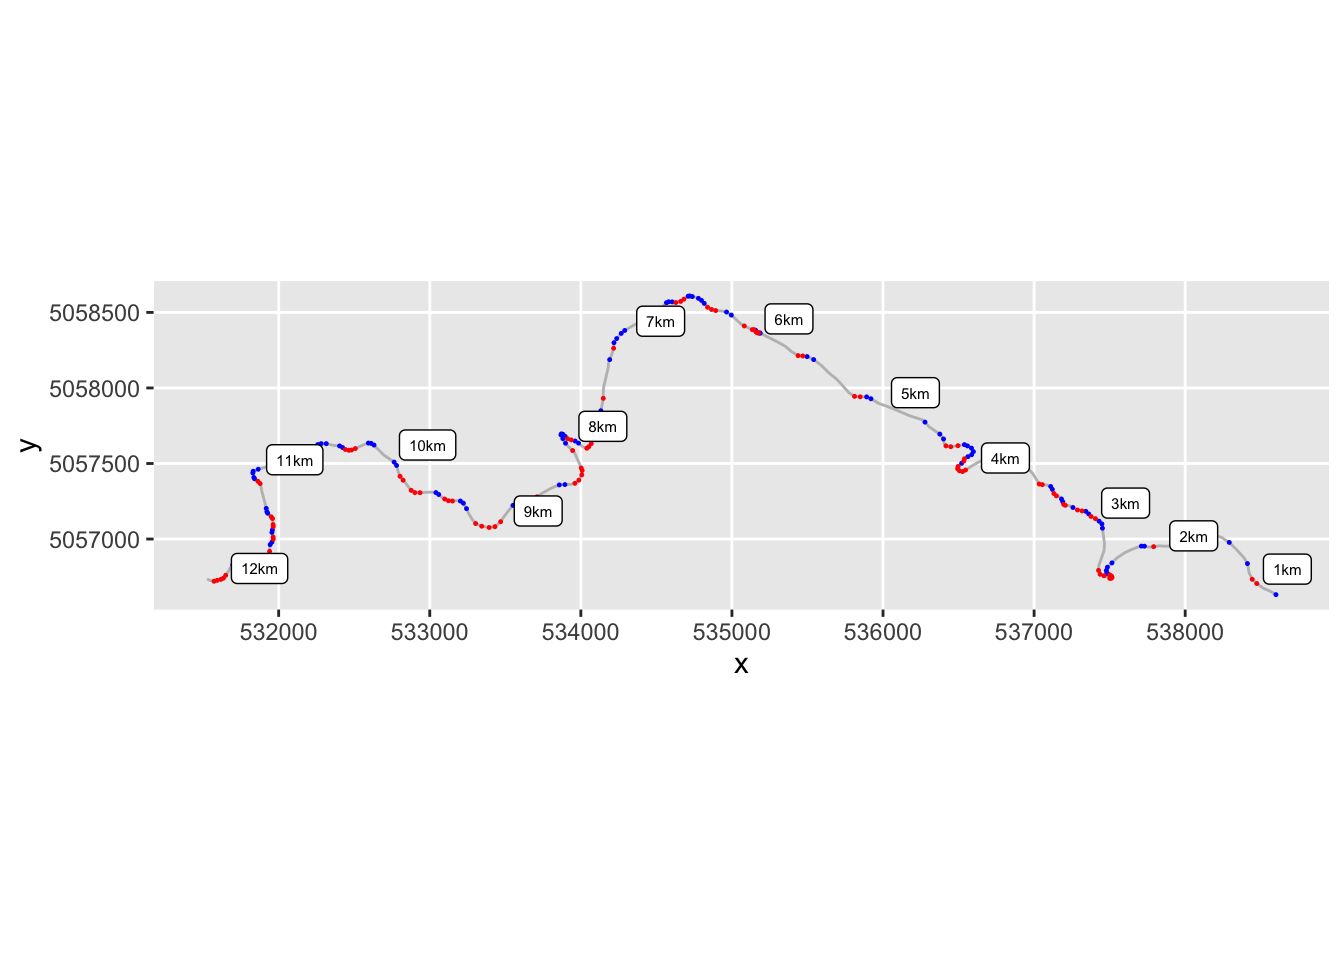
8.1 Stage Route Preview
Static map, significant corners highlighted:
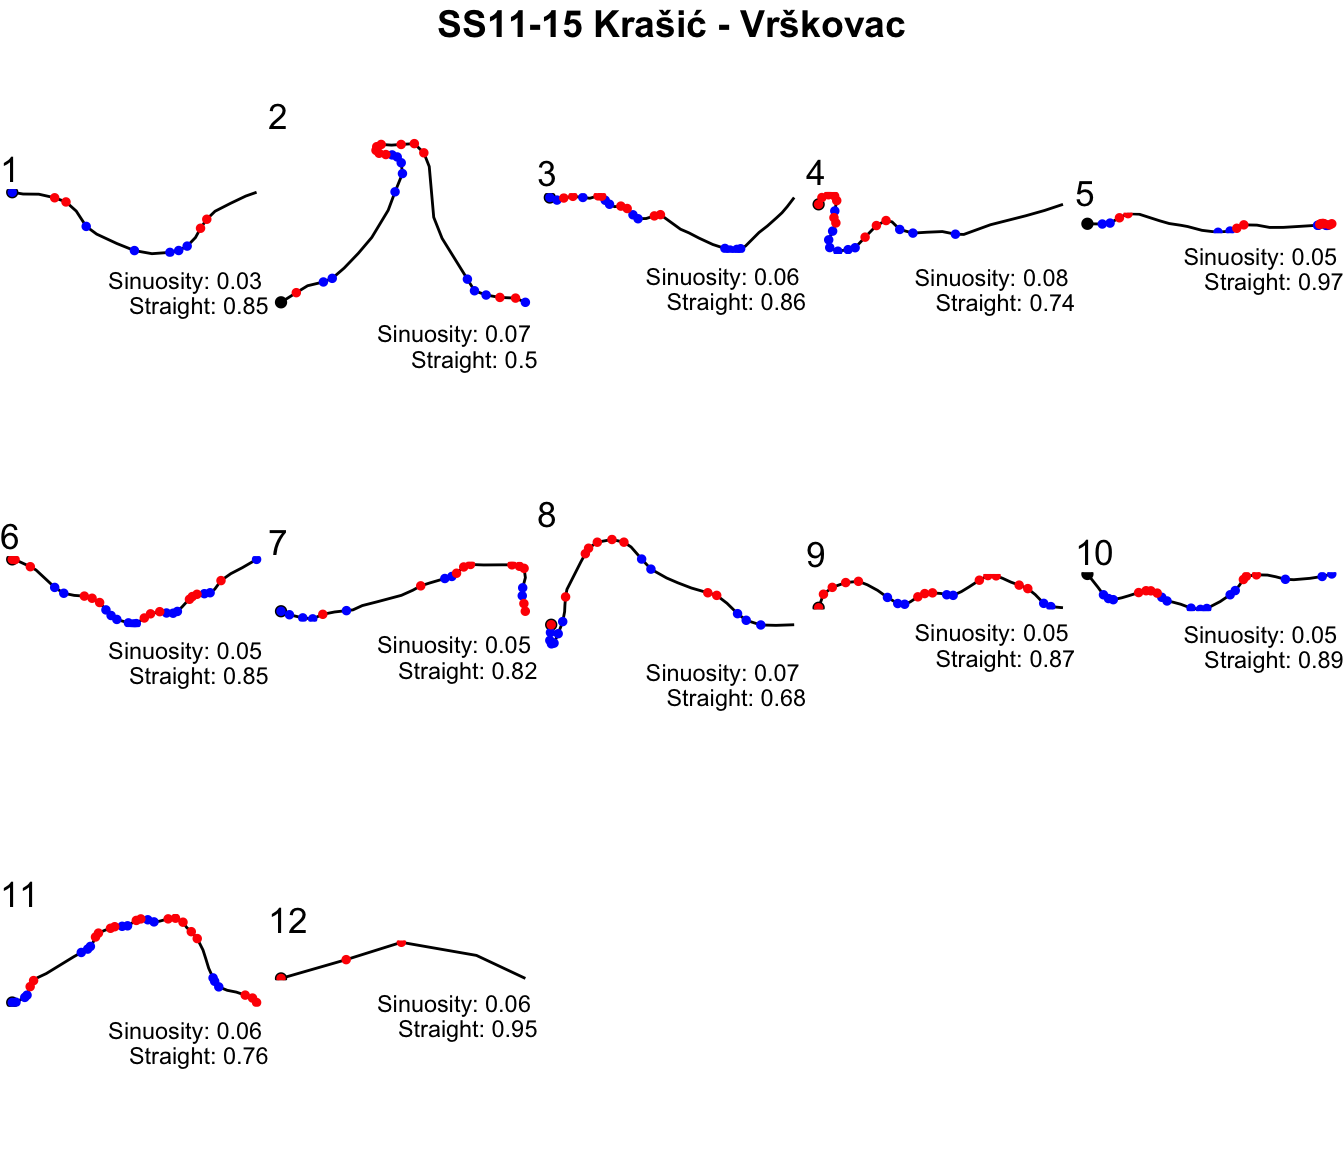
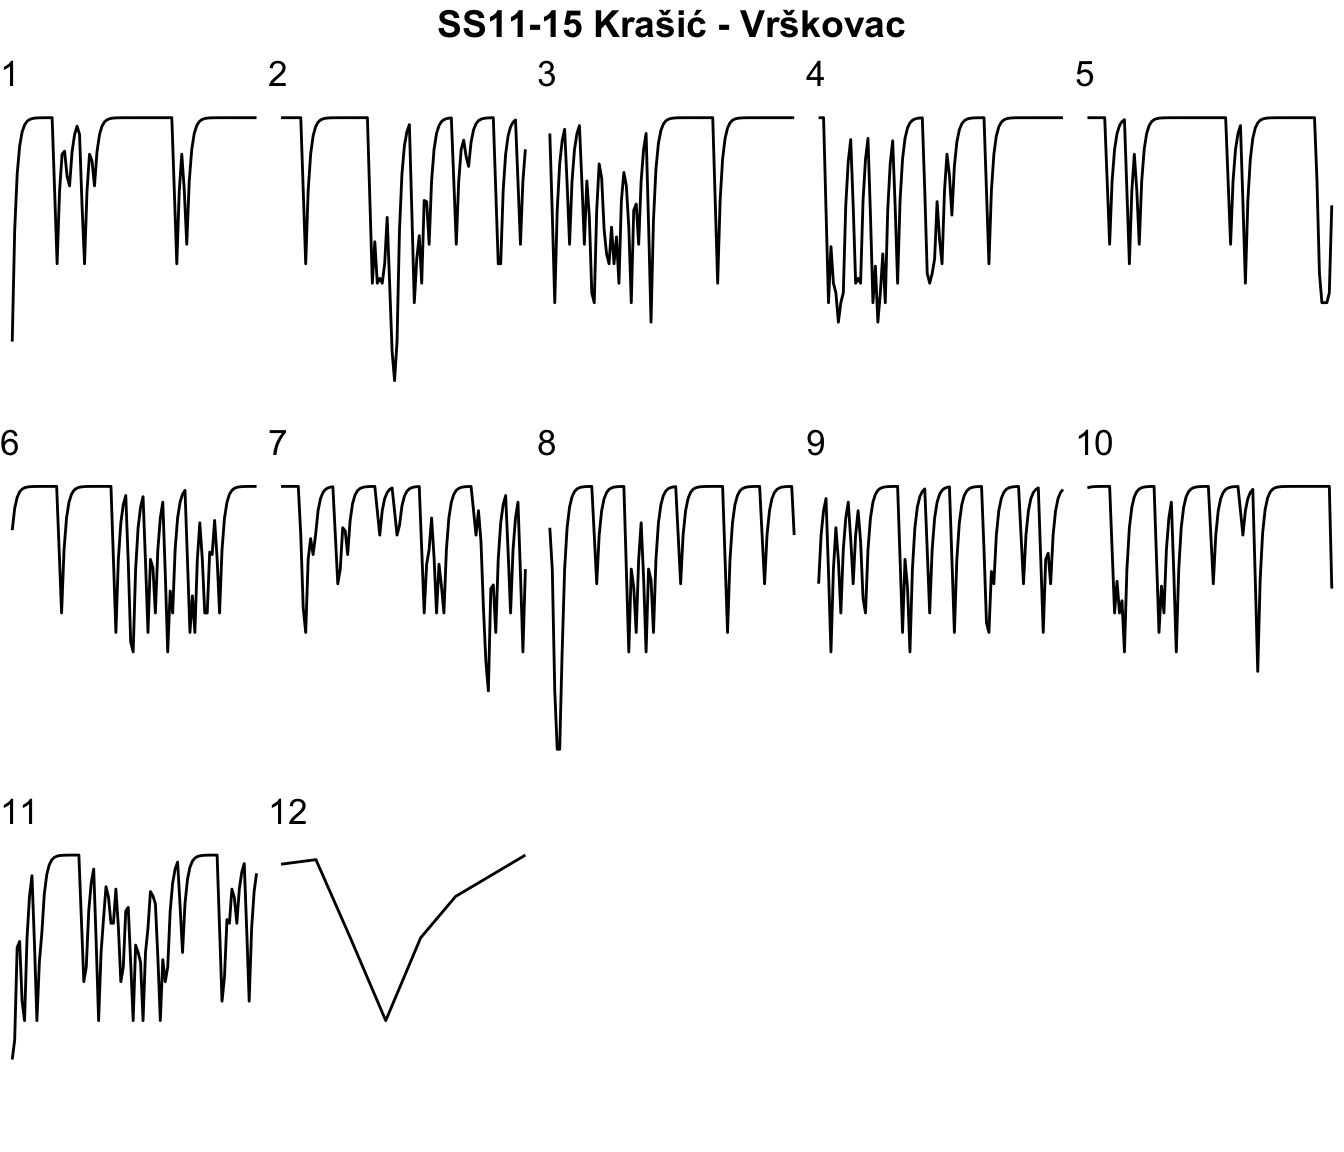
8.2 Segmented Route
1km route sections, aligned to read left to right; significant corners highlighted.
8.3 Speed Estimates
Estimates of speed along the route according to a very simple acceleration model.
Kilometer section speeds (kmtime is time in seconds to complete that kilometer; avspeed is in km/h):
| kmsection | km_time | av_speed | maxspeed |
|---|---|---|---|
| 1 | 28.120823 | 128.01901 | 145.0000 |
| 2 | 37.139701 | 96.93131 | 145.0000 |
| 3 | 32.365937 | 111.22805 | 145.0000 |
| 4 | 35.666633 | 100.93467 | 145.0000 |
| 5 | 29.478401 | 122.12331 | 145.0000 |
| 6 | 30.541945 | 117.87068 | 144.9999 |
| 7 | 30.814733 | 116.82723 | 145.0000 |
| 8 | 36.471141 | 98.70818 | 144.9996 |
| 9 | 30.828215 | 116.77614 | 144.9921 |
| 10 | 28.934522 | 124.41885 | 145.0000 |
| 11 | 34.188346 | 105.29904 | 144.9988 |
| 12 | 2.620475 | 1373.79660 | 145.0000 |
Anticipated stage time: 5m 57.2s
Speed profile chart: this chart shows the anticipated speed over distance into route on a per kilometer basis:
8.4 Elevation and Convexity Index into Route
Elevation and significant curvature vs distance into stage:
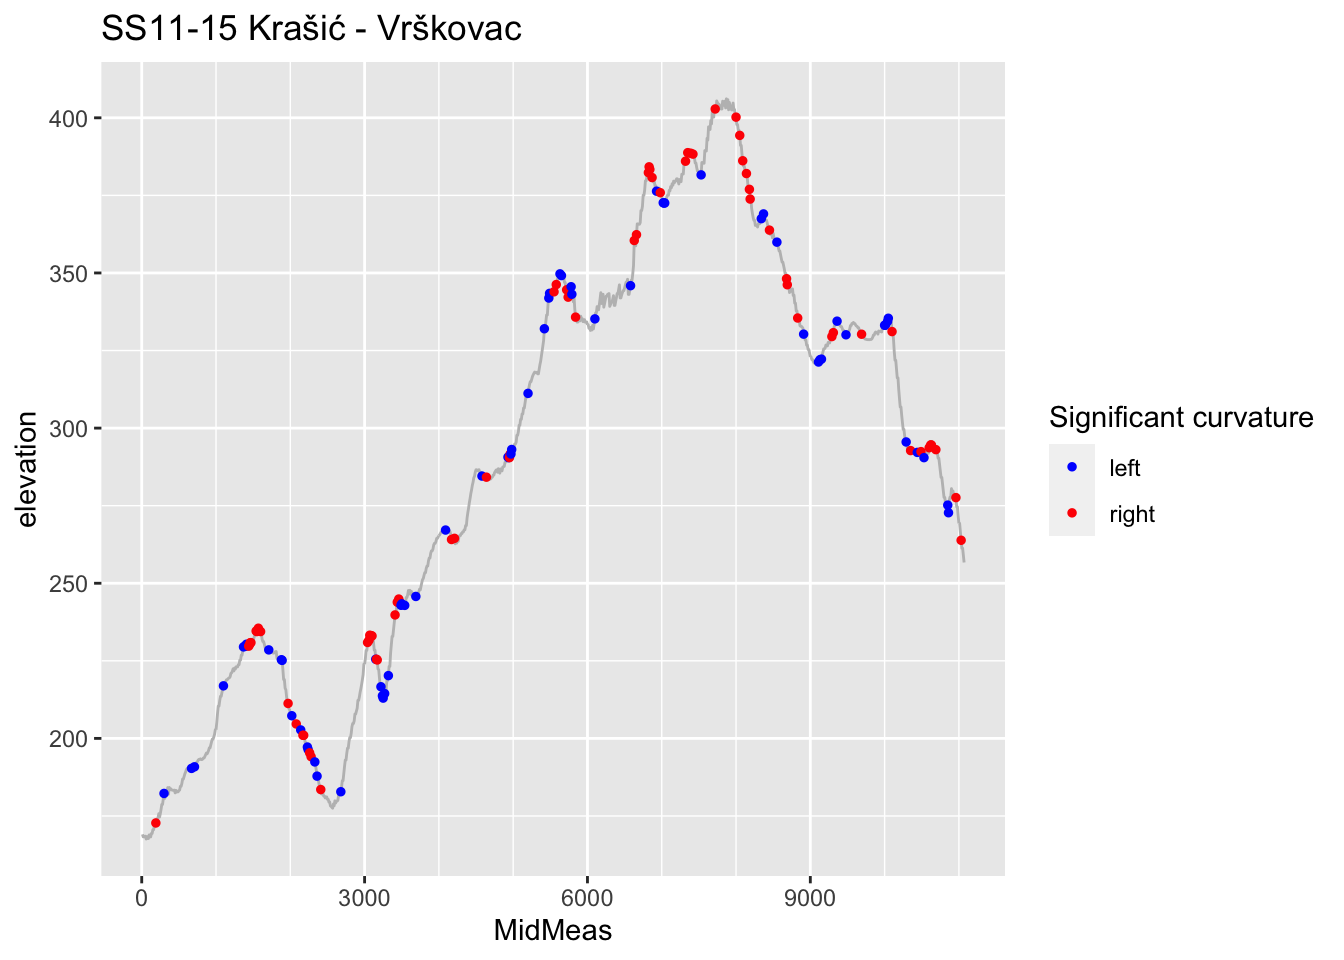
(Note that this uses a different curvature measure to the route plots; specifically, the curvature measure used here is the convexity index.)
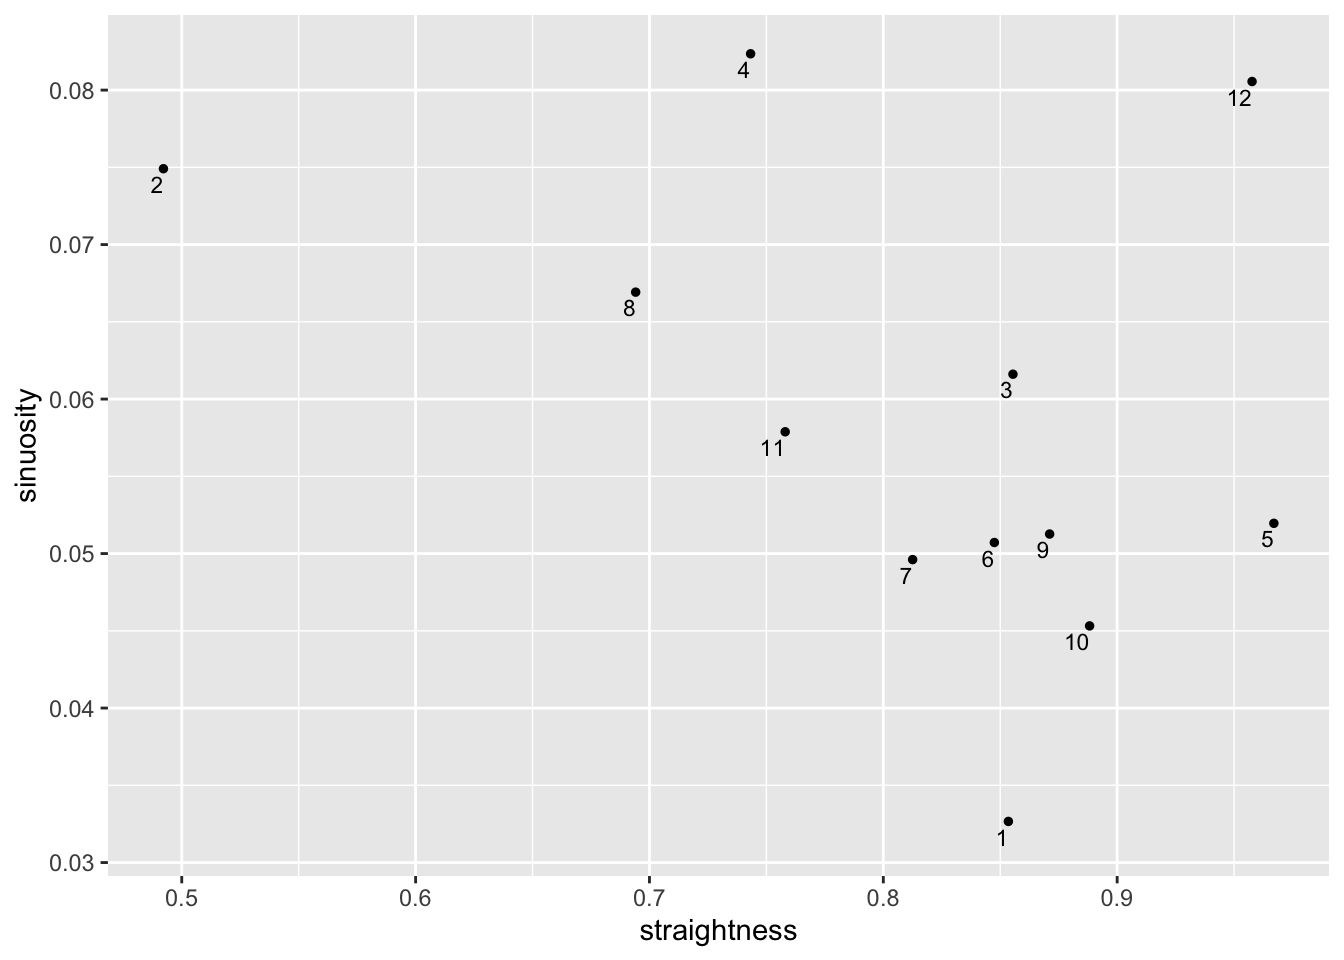
| km | sinuosity | straightness | route |
|---|---|---|---|
| 1 | 0.03266255 | 0.8534876 |

|
| 2 | 0.07491155 | 0.4921661 |

|
| 3 | 0.06161048 | 0.8554384 |

|
| 4 | 0.08235188 | 0.7432560 |

|
| 5 | 0.05195858 | 0.9670110 |

|
| 6 | 0.05071659 | 0.8474831 |

|
| 7 | 0.04961001 | 0.8125403 |

|
| 8 | 0.06692265 | 0.6941016 |

|
| 9 | 0.05126560 | 0.8711246 |

|
| 10 | 0.04531857 | 0.8882161 |

|
| 11 | 0.05788342 | 0.7580409 |

|
| 12 | 0.08055656 | 0.9576887 |

|