2 SS01/05 Rude - Plešivica
A quick review of the stage, detailing the overall route, the route in 1km sections, route elevation profile and route curvature profile.
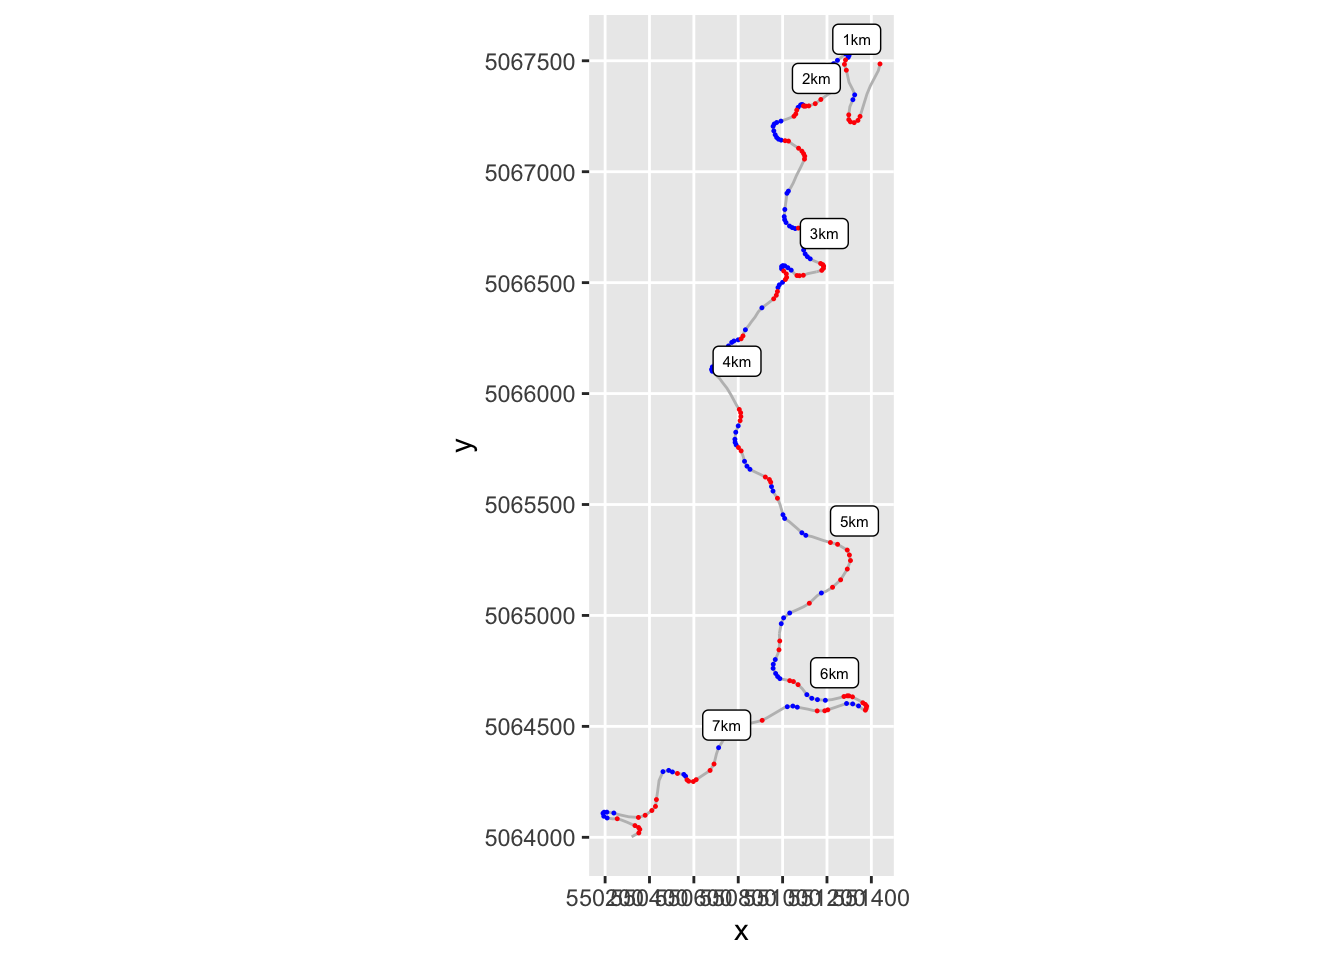
2.1 Stage Route Preview
Static map, significant corners highlighted:
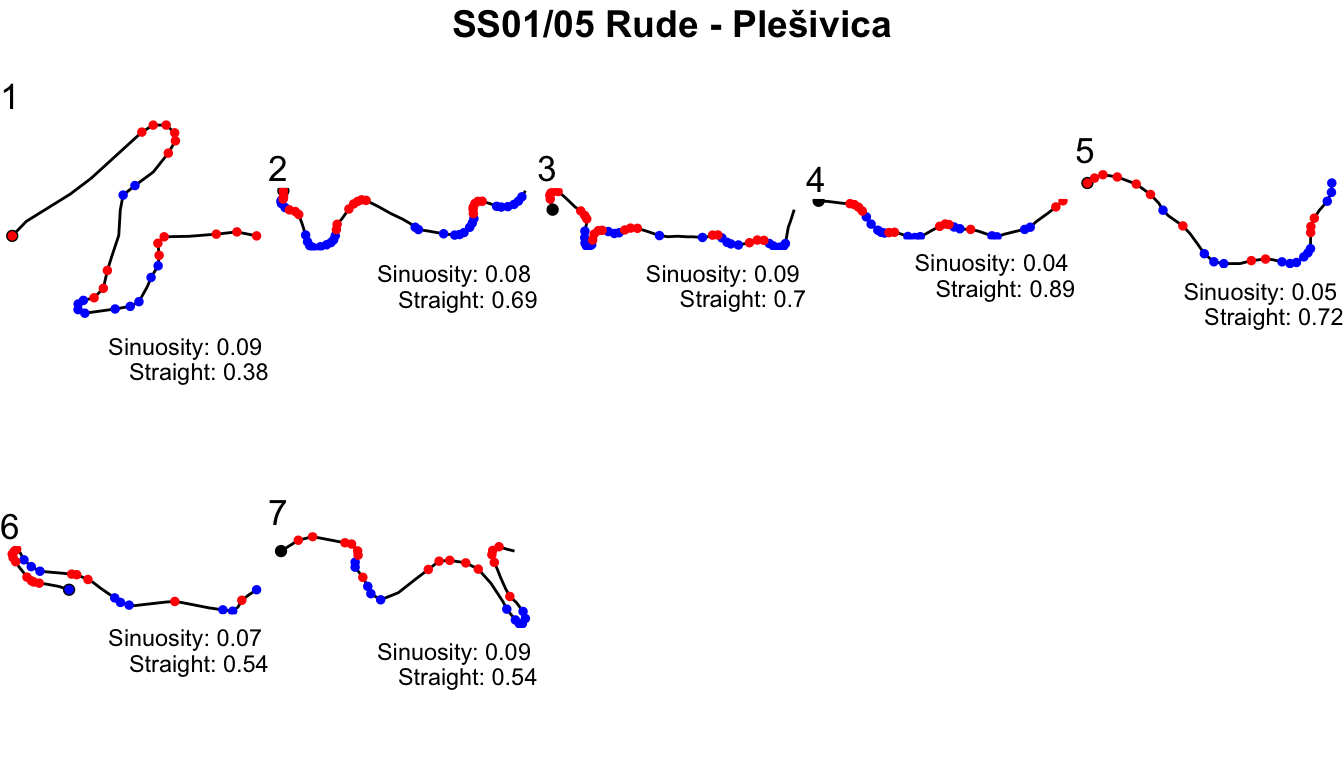
2.2 Segmented Route
1km route sections, aligned to read left to right; significant corners highlighted.
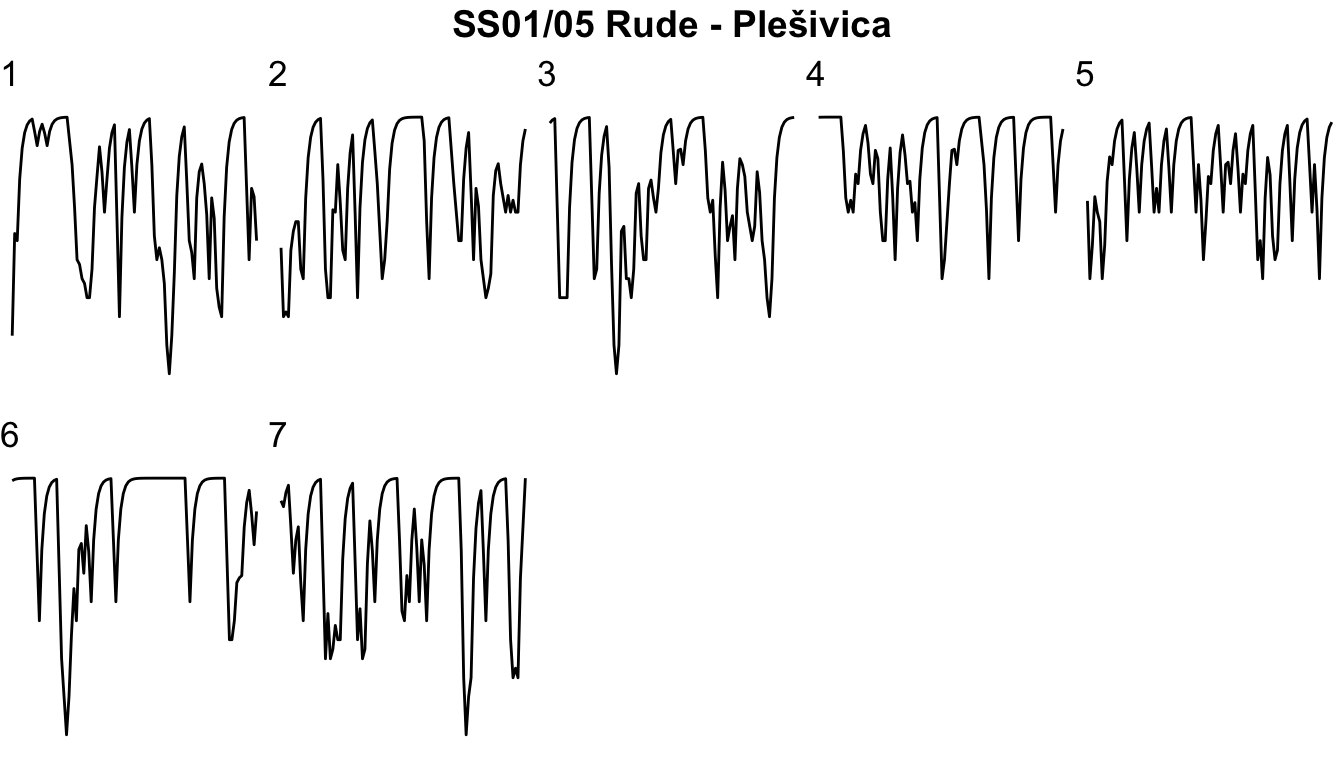
2.3 Speed Estimates
Estimates of speed along the route according to a very simple acceleration model.
Kilometer section speeds (kmtime is time in seconds to complete that kilometer; avspeed is in km/h):
| kmsection | km_time | av_speed | maxspeed |
|---|---|---|---|
| 1 | 42.60874 | 84.48971 | 144.9414 |
| 2 | 37.93151 | 94.90790 | 144.9966 |
| 3 | 42.90837 | 83.89971 | 144.9023 |
| 4 | 30.22165 | 119.11989 | 144.9998 |
| 5 | 33.11955 | 108.69715 | 144.8047 |
| 6 | 35.27041 | 102.06856 | 145.0000 |
| 7 | 41.61815 | 86.50073 | 145.0000 |
Anticipated stage time: 4m 23.7s
Speed profile chart: this chart shows the anticipated speed over distance into route on a per kilometer basis:
2.4 Elevation and Convexity Index into Route
Elevation and significant curvature vs distance into stage:
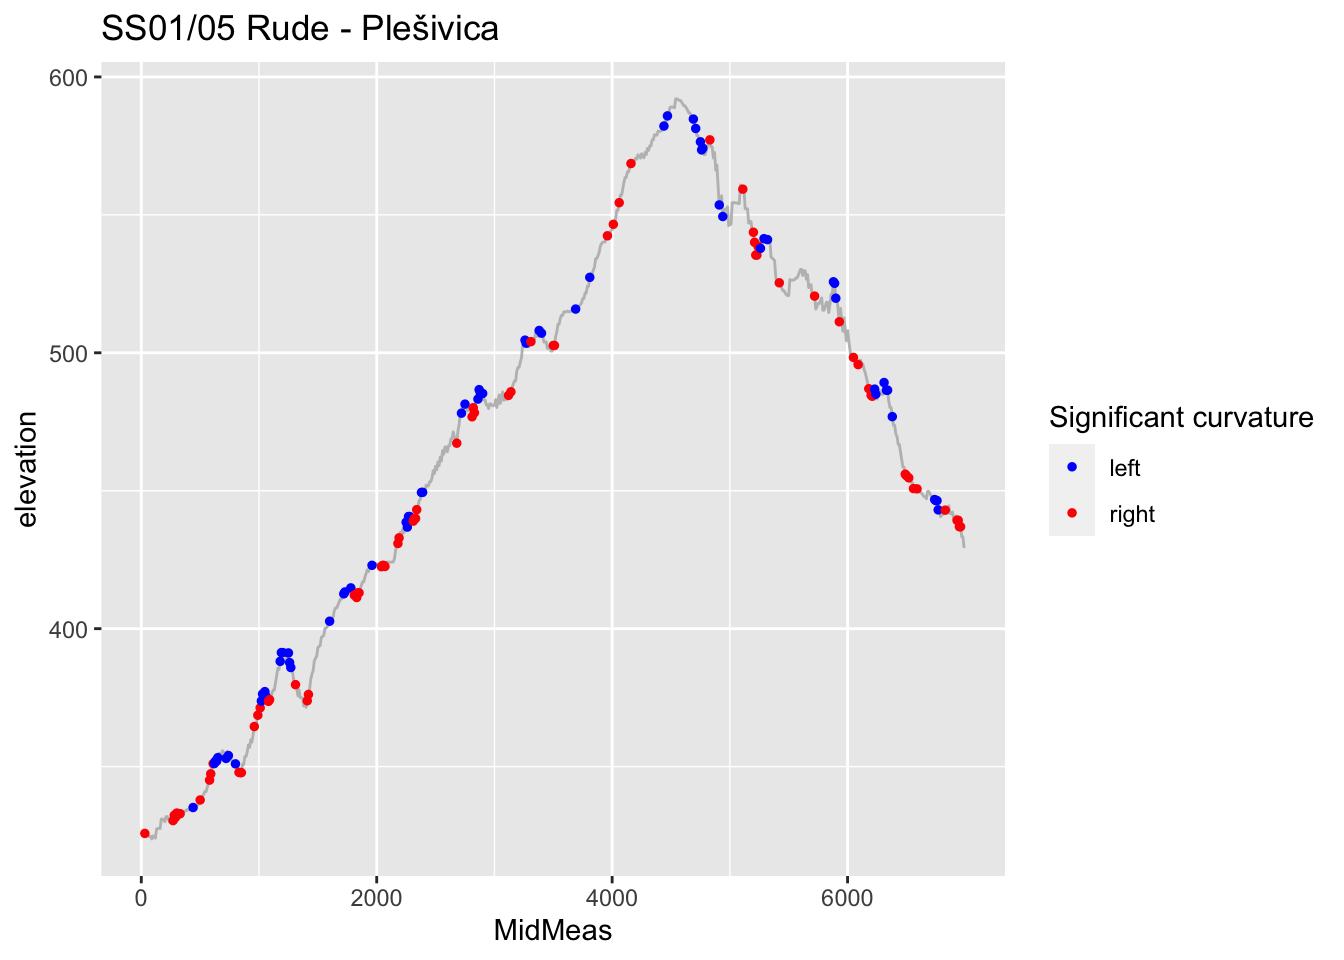
(Note that this uses a different curvature measure to the route plots; specifically, the curvature measure used here is the convexity index.)
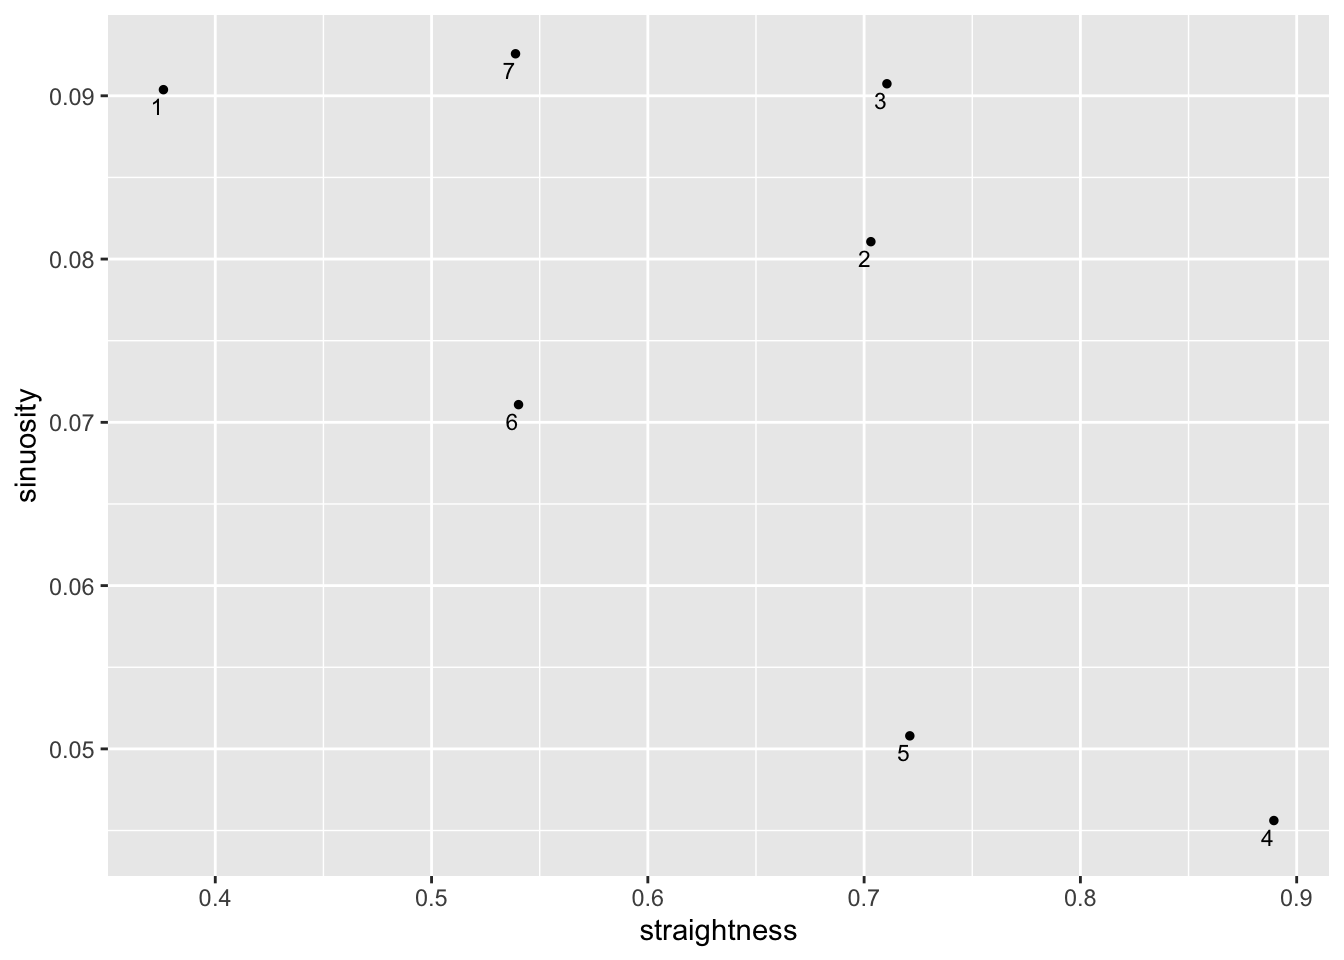
| km | sinuosity | straightness | route |
|---|---|---|---|
| 1 | 0.09037453 | 0.3760311 |

|
| 2 | 0.08106481 | 0.7031239 |

|
| 3 | 0.09073689 | 0.7105400 |

|
| 4 | 0.04561115 | 0.8894491 |

|
| 5 | 0.05079860 | 0.7211294 |

|
| 6 | 0.07108416 | 0.5402181 |

|
| 7 | 0.09257352 | 0.5388202 |

|