11 SS18-20 Zagorska Sela - Kumrovec
A quick review of the stage, detailing the overall route, the route in 1km sections, route elevation profile and route curvature profile.
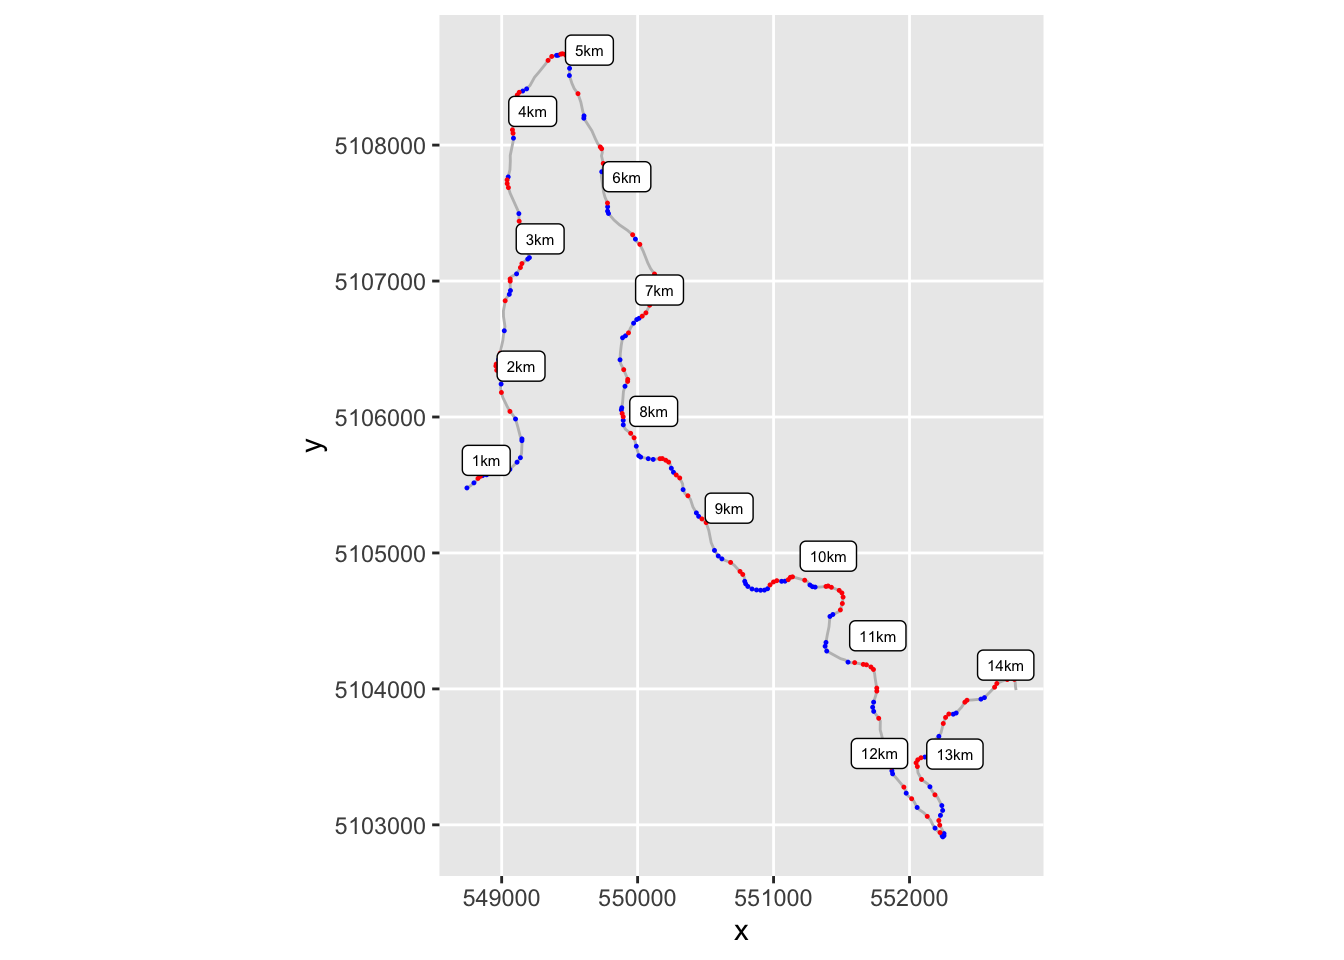
11.1 Stage Route Preview
Static map, significant corners highlighted:
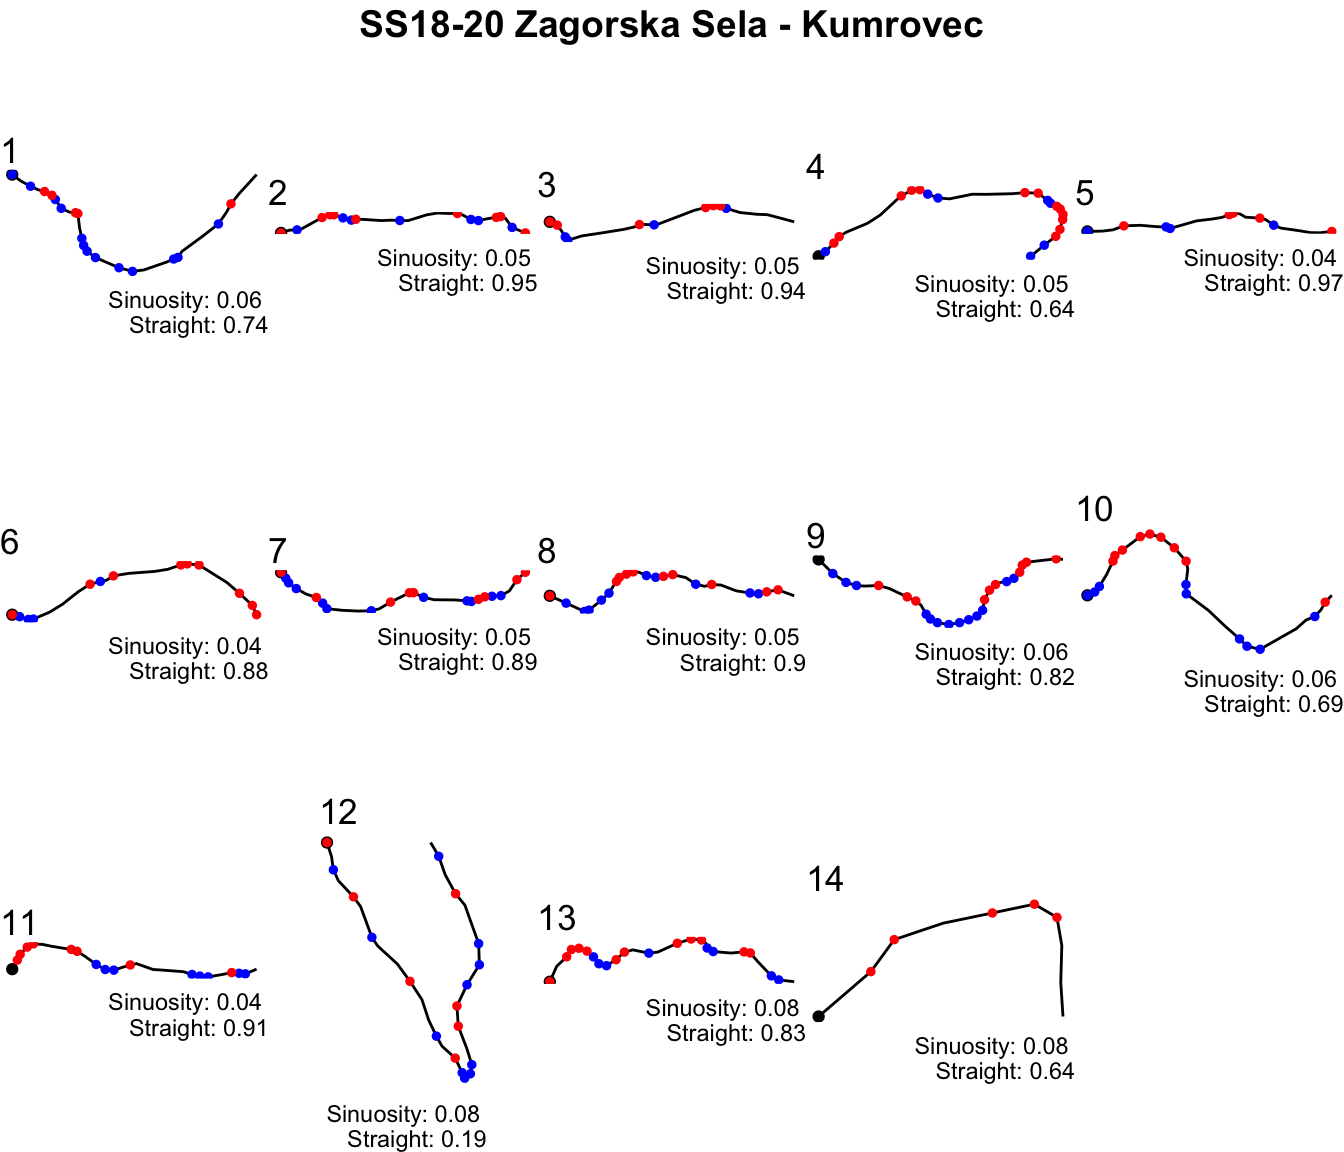
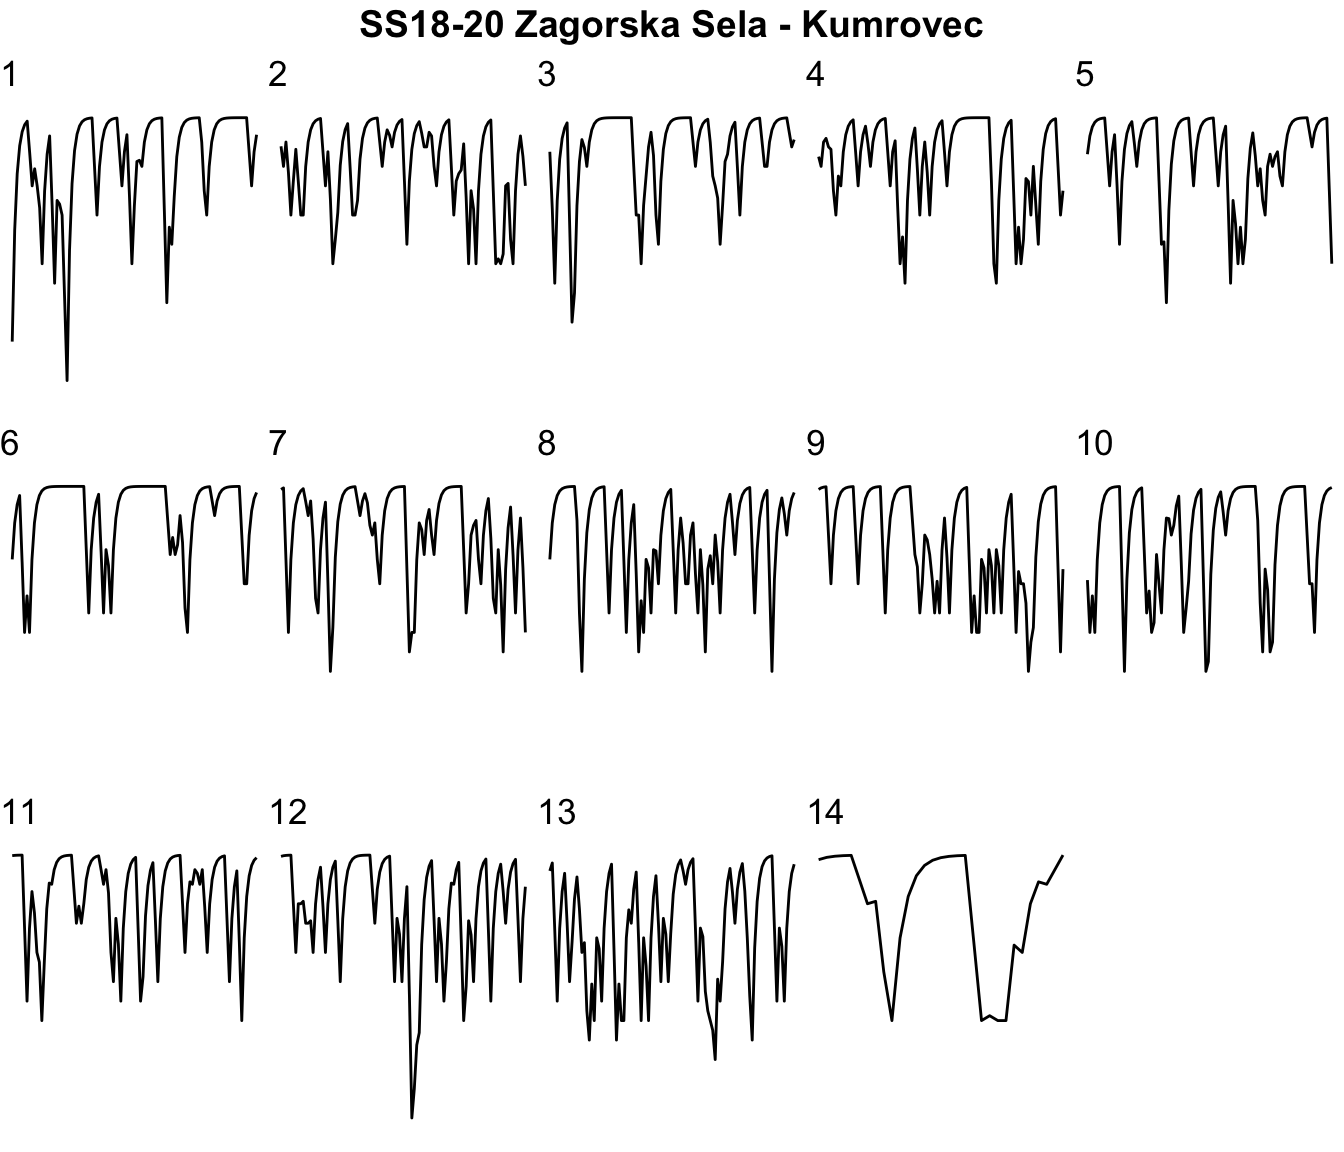
11.2 Segmented Route
1km route sections, aligned to read left to right; significant corners highlighted.
11.3 Speed Estimates
Estimates of speed along the route according to a very simple acceleration model.
Kilometer section speeds (kmtime is time in seconds to complete that kilometer; avspeed is in km/h):
| kmsection | km_time | av_speed | maxspeed |
|---|---|---|---|
| 1 | 34.24901 | 105.11253 | 144.9992 |
| 2 | 31.30443 | 114.99971 | 144.8340 |
| 3 | 29.64525 | 121.43596 | 144.9999 |
| 4 | 30.59369 | 117.67132 | 144.9997 |
| 5 | 30.04272 | 119.82937 | 144.9658 |
| 6 | 28.57646 | 125.97781 | 145.0000 |
| 7 | 31.66695 | 113.68318 | 144.9829 |
| 8 | 32.39951 | 111.11278 | 144.9634 |
| 9 | 32.62988 | 110.32833 | 144.9365 |
| 10 | 32.63246 | 110.31961 | 144.9939 |
| 11 | 30.42102 | 118.33921 | 144.9817 |
| 12 | 36.38697 | 98.93653 | 144.9841 |
| 13 | 37.42916 | 96.18168 | 144.6289 |
| 14 | 10.39168 | 346.43103 | 145.0000 |
Anticipated stage time: 7m 8.4s
Speed profile chart: this chart shows the anticipated speed over distance into route on a per kilometer basis:
11.4 Elevation and Convexity Index into Route
Elevation and significant curvature vs distance into stage:
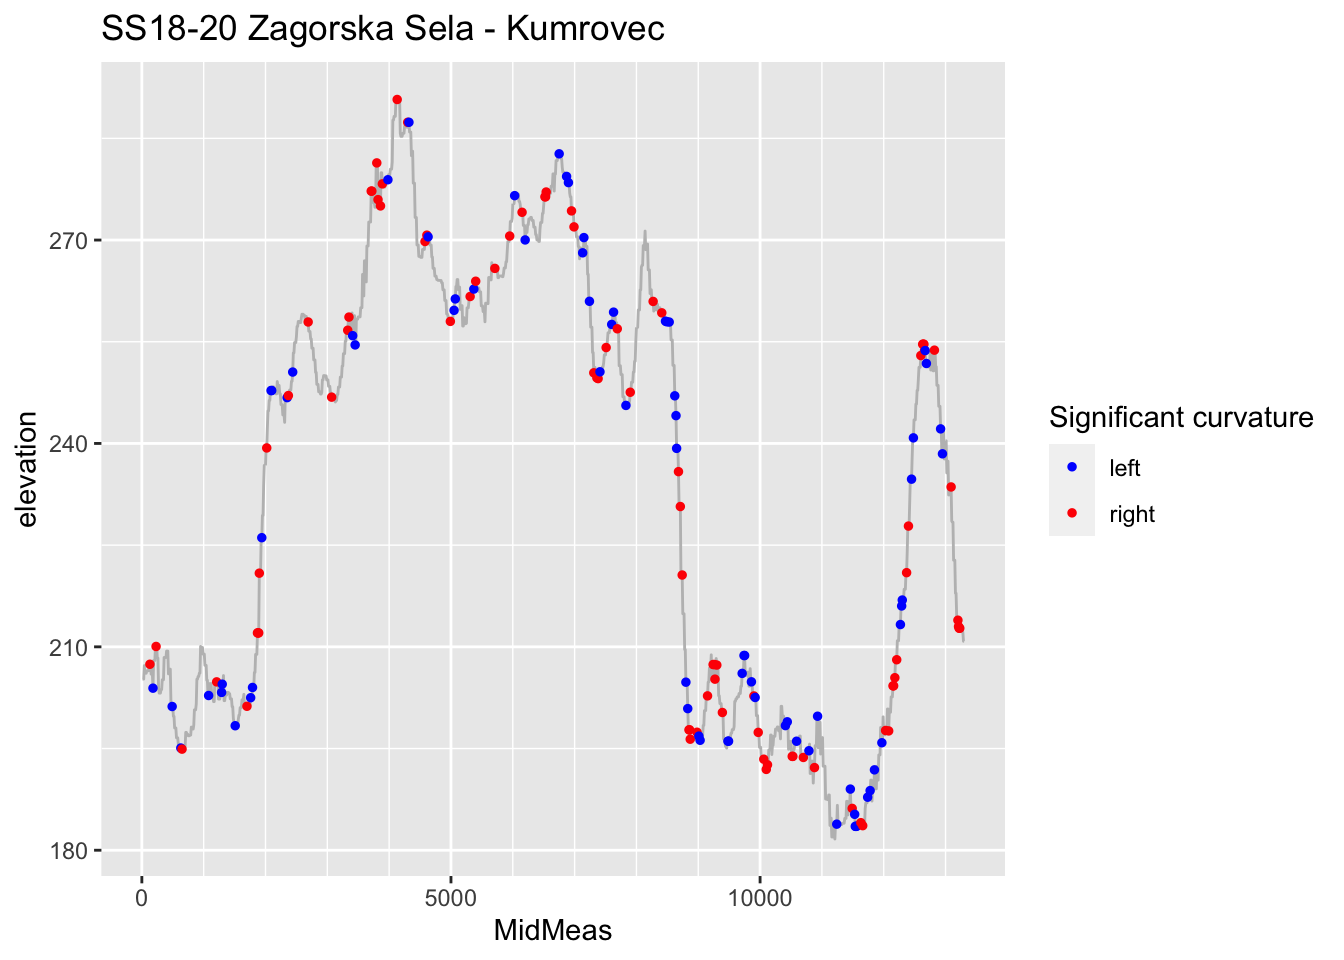
(Note that this uses a different curvature measure to the route plots; specifically, the curvature measure used here is the convexity index.)
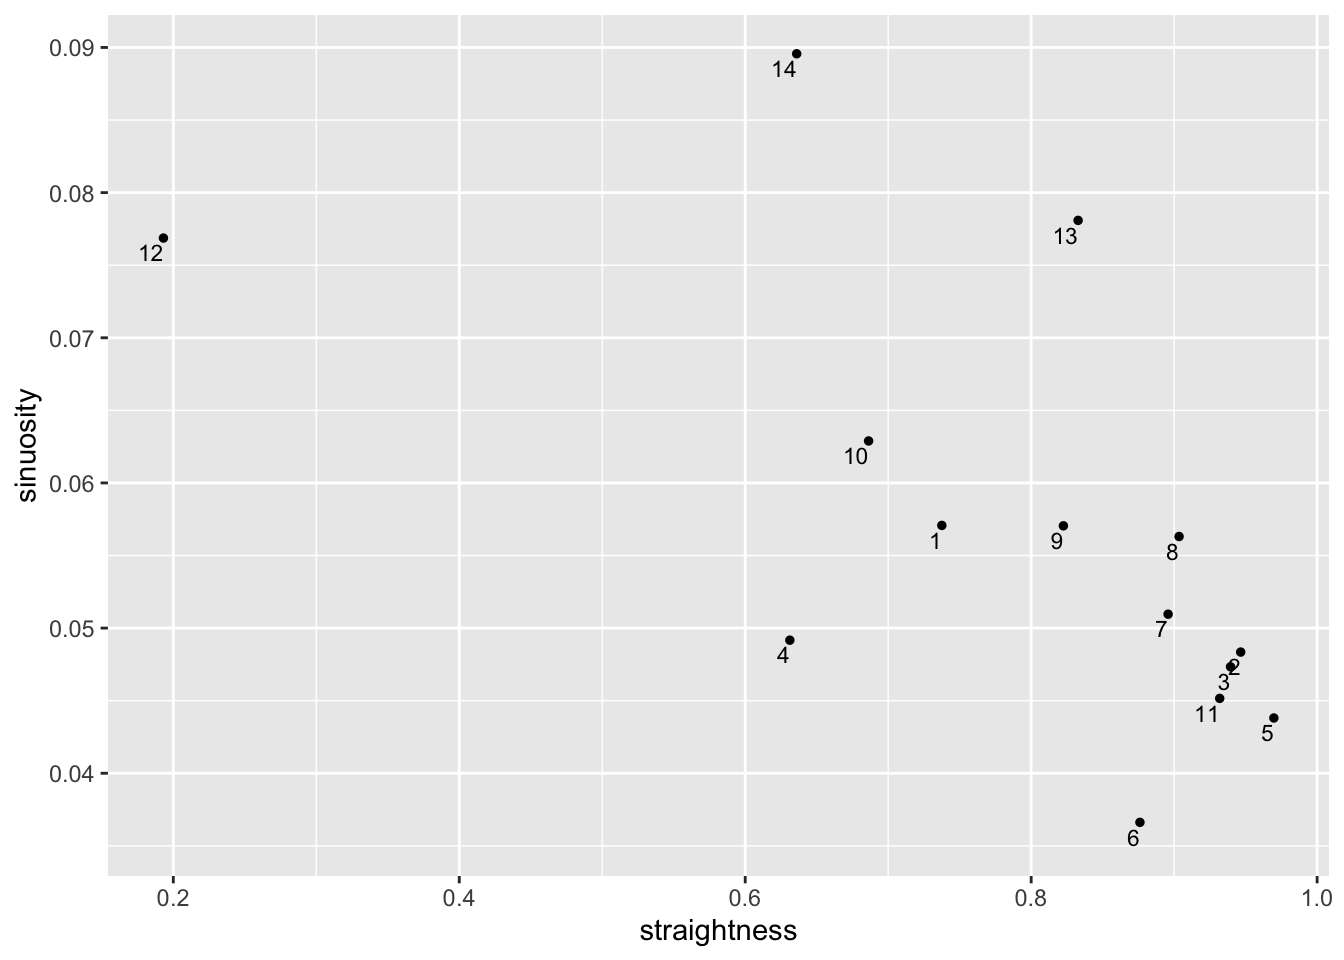
| km | sinuosity | straightness | route |
|---|---|---|---|
| 1 | 0.05707411 | 0.7375077 |

|
| 2 | 0.04834798 | 0.9465459 |

|
| 3 | 0.04733587 | 0.9394255 |

|
| 4 | 0.04916707 | 0.6312109 |

|
| 5 | 0.04380736 | 0.9697428 |

|
| 6 | 0.03661716 | 0.8760687 |

|
| 7 | 0.05095841 | 0.8957748 |

|
| 8 | 0.05630892 | 0.9034408 |

|
| 9 | 0.05704558 | 0.8225335 |

|
| 10 | 0.06289215 | 0.6862915 |

|
| 11 | 0.04515773 | 0.9318632 |

|
| 12 | 0.07687092 | 0.1930951 |

|
| 13 | 0.07808794 | 0.8328221 |

|
| 14 | 0.08956620 | 0.6360003 |

|